Fig. 7.
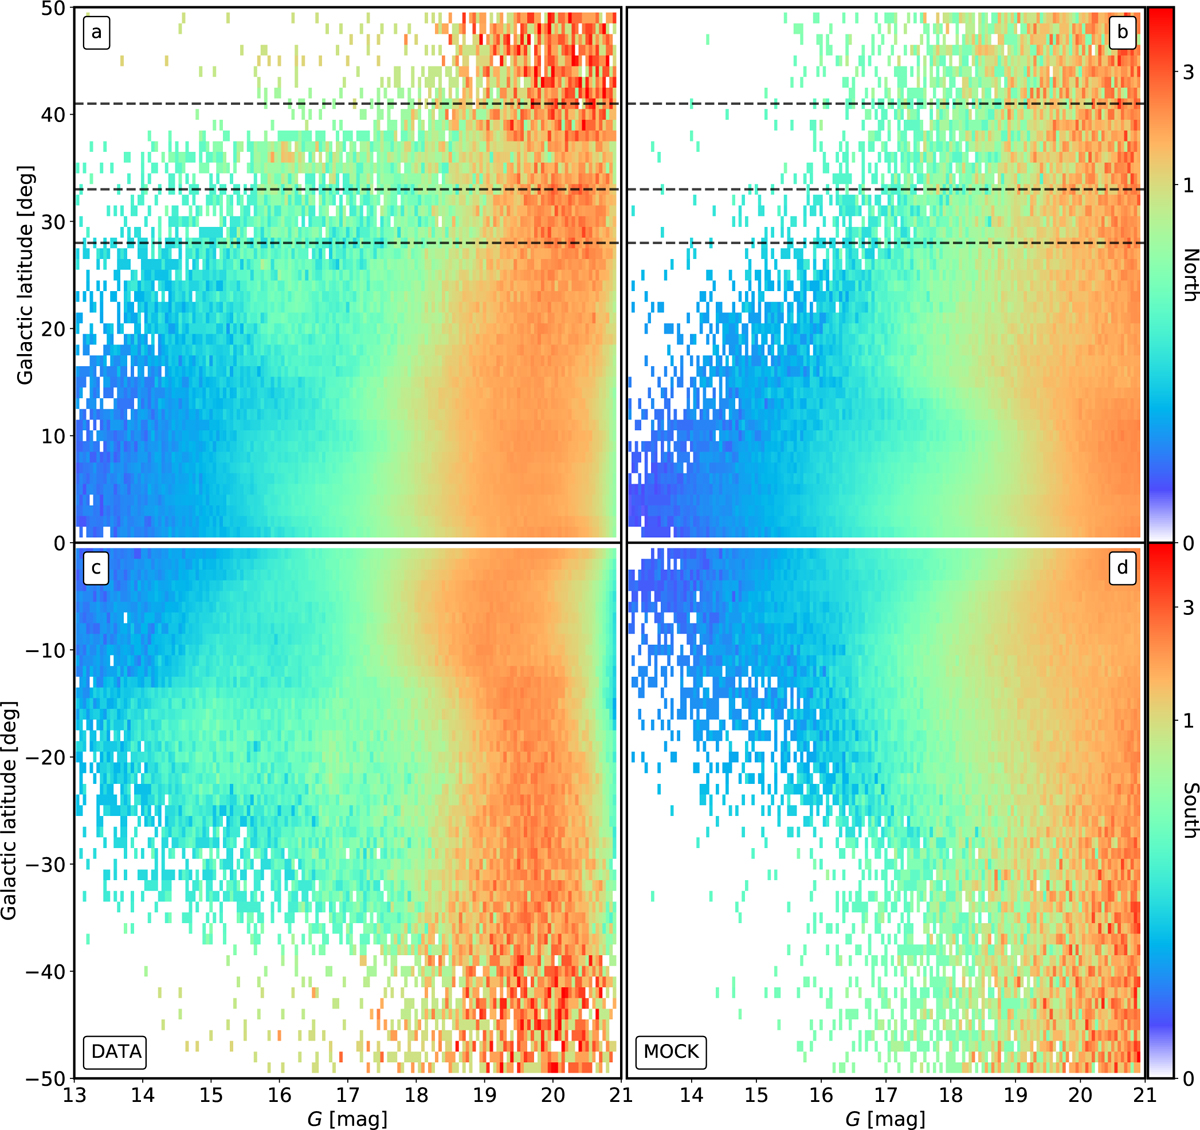
Apparent magnitude as a function of Galactic latitude for the stars in the peaks with 130° < l < 150°. Left: data. Right: mock. The histograms are normalised such that the sum of all pixels in a given bin of b adds up to unity. A conspicuous overdensity of stars can be clearly seen appearing at G ∼ 16 mag and extending from 15° < b < 40°. The horizontal lines are taken from Fig. 4 and represent the latitude limits of MNC and the ACS as seen in the sky.
Current usage metrics show cumulative count of Article Views (full-text article views including HTML views, PDF and ePub downloads, according to the available data) and Abstracts Views on Vision4Press platform.
Data correspond to usage on the plateform after 2015. The current usage metrics is available 48-96 hours after online publication and is updated daily on week days.
Initial download of the metrics may take a while.