Fig. 6.
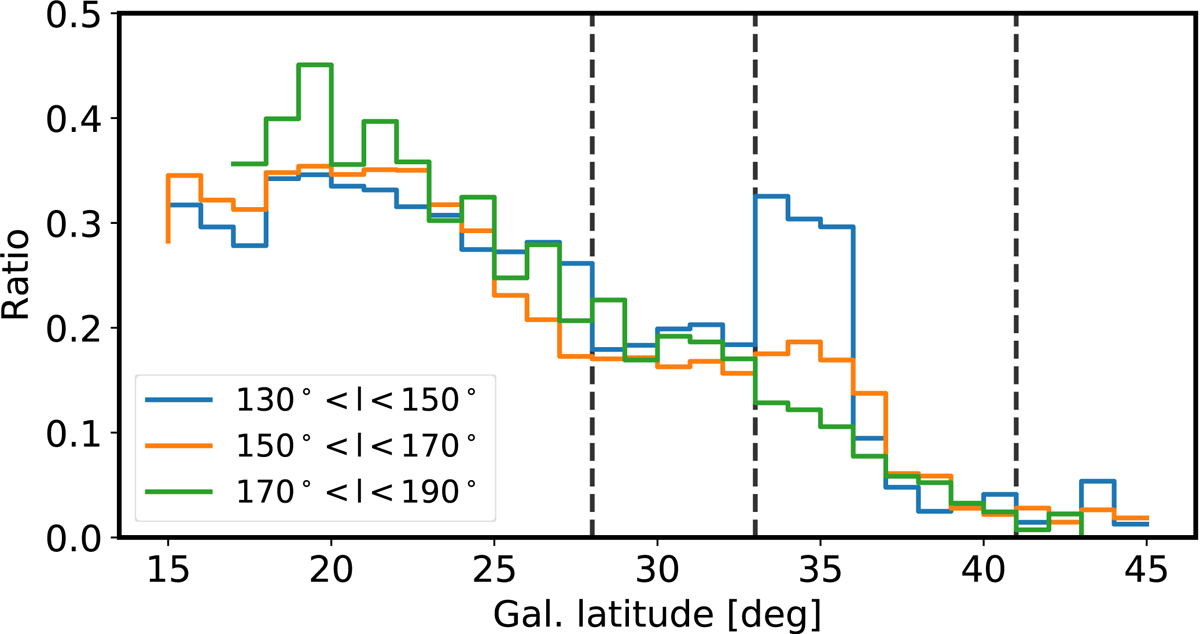
Ratio of giants in the peak compared to all the giants as a function of Galactic latitude for three different ranges in longitude: 130° < l < 150° (blue), 150° < l < 170° (orange), and 170° < l < 190° (green). The vertical lines give an orientation of the end of each structure with Galactic latitude (cf. Fig. 4). A sudden increase in the ratio can be seen in the part where the ACS is the more intense.
Current usage metrics show cumulative count of Article Views (full-text article views including HTML views, PDF and ePub downloads, according to the available data) and Abstracts Views on Vision4Press platform.
Data correspond to usage on the plateform after 2015. The current usage metrics is available 48-96 hours after online publication and is updated daily on week days.
Initial download of the metrics may take a while.