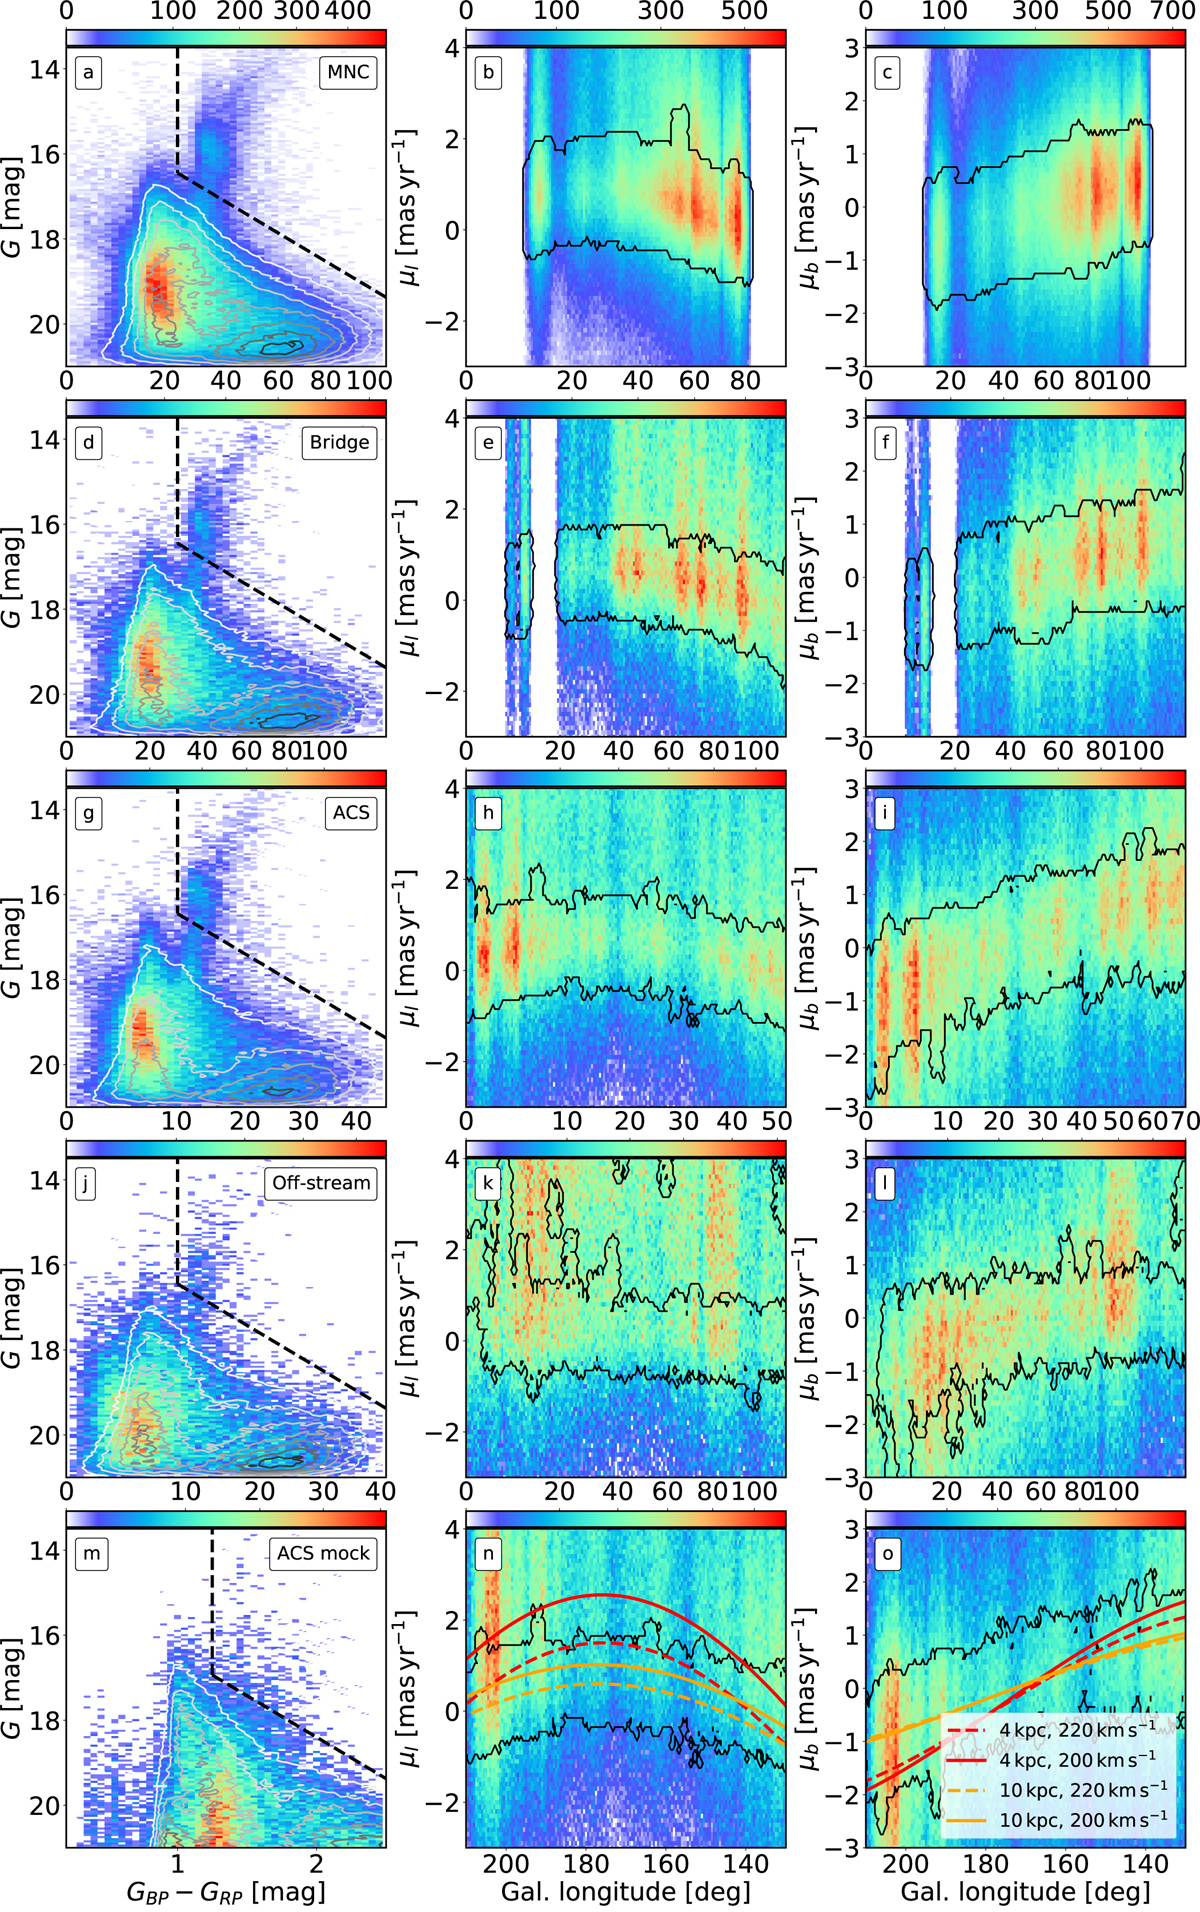
Fig. 5.

CMD (left) and proper motion trends with Galactic longitude in μl (middle) and μb (right) of each structure. The CMDs contain the histogram of the stars within the highest intensity proper motion peaks (peak stars) with grey contours on top that represent the CMDs of all the stars in the region. The dashed black lines represent our selection of giant stars. The proper motion maps contain all the stars in the region, and the black line is the zero-contour of the peak stars, that is, the stars that fall within the highest intensity proper motion peak of their HEALpix. First row: MNC. Second row: bridge between MNC and the ACS. Third row: ACS. Fourth row: above the ACS. Fifth row: same region as the ACS but for the mock particles, selecting the stars for the CMD according to the contours of panels h and i. In the bottom panel we also include the proper motions expected from a structure 30° above the plane at a given distance – 4 (red) or 10 (orange) kpc – rotating at a given velocity – 200 (solid) or 220 (dashed) km s−1 – but with no radial or vertical velocity.
Current usage metrics show cumulative count of Article Views (full-text article views including HTML views, PDF and ePub downloads, according to the available data) and Abstracts Views on Vision4Press platform.
Data correspond to usage on the plateform after 2015. The current usage metrics is available 48-96 hours after online publication and is updated daily on week days.
Initial download of the metrics may take a while.


