Fig. 4.
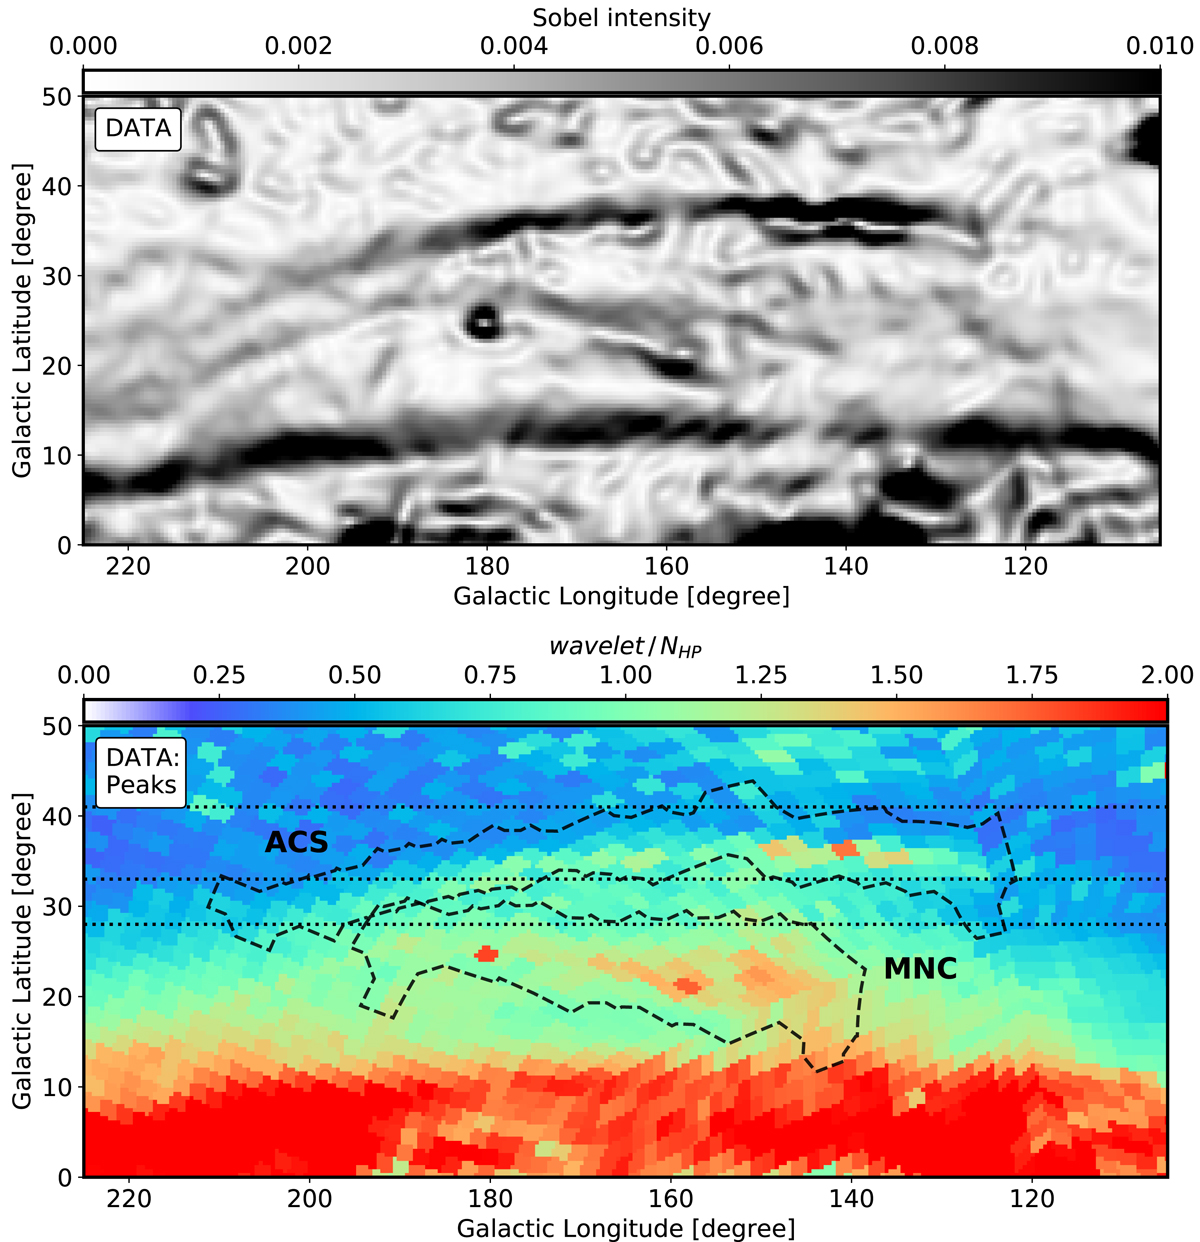
Zoom-in on the anticentre region and definition of the patches. Top: result of applying a Gaussian smoothing plus Sobel filter to Fig. 1 in the region: 110° < l < 220°, −50° < b < 50°. We use this map to isolate the ACS and MNC. Bottom: wavelet/NHP (relative peak intensity) of the same region. The black contours delineate the regions that we isolated according to the upper panel, while the dotted horizontal lines (b = [28°, 33°, 41°]) give an approximate limit for the structures in latitude at l ∼ 170°.
Current usage metrics show cumulative count of Article Views (full-text article views including HTML views, PDF and ePub downloads, according to the available data) and Abstracts Views on Vision4Press platform.
Data correspond to usage on the plateform after 2015. The current usage metrics is available 48-96 hours after online publication and is updated daily on week days.
Initial download of the metrics may take a while.