Fig. 1.
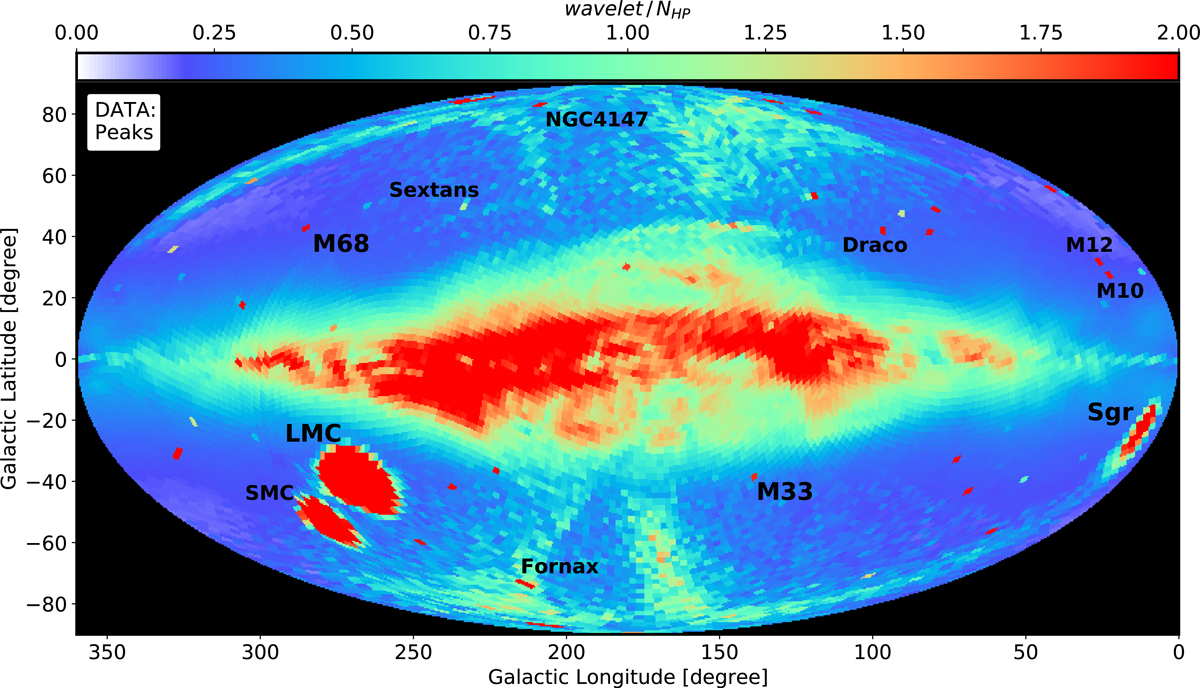
Mollweide projection of the dominant peak in proper motion space detected at each HEALpix. The data are coloured by the relative intensity (Eq. (2)). By showing only the most significant kinematic overdensity and normalising to the number of stars in the HEALpix, a large number of structures become visible: the Sgr stream, tens of globular clusters, and an intricate anticentre. We have labelled some of most relevant ones.
Current usage metrics show cumulative count of Article Views (full-text article views including HTML views, PDF and ePub downloads, according to the available data) and Abstracts Views on Vision4Press platform.
Data correspond to usage on the plateform after 2015. The current usage metrics is available 48-96 hours after online publication and is updated daily on week days.
Initial download of the metrics may take a while.