Open Access
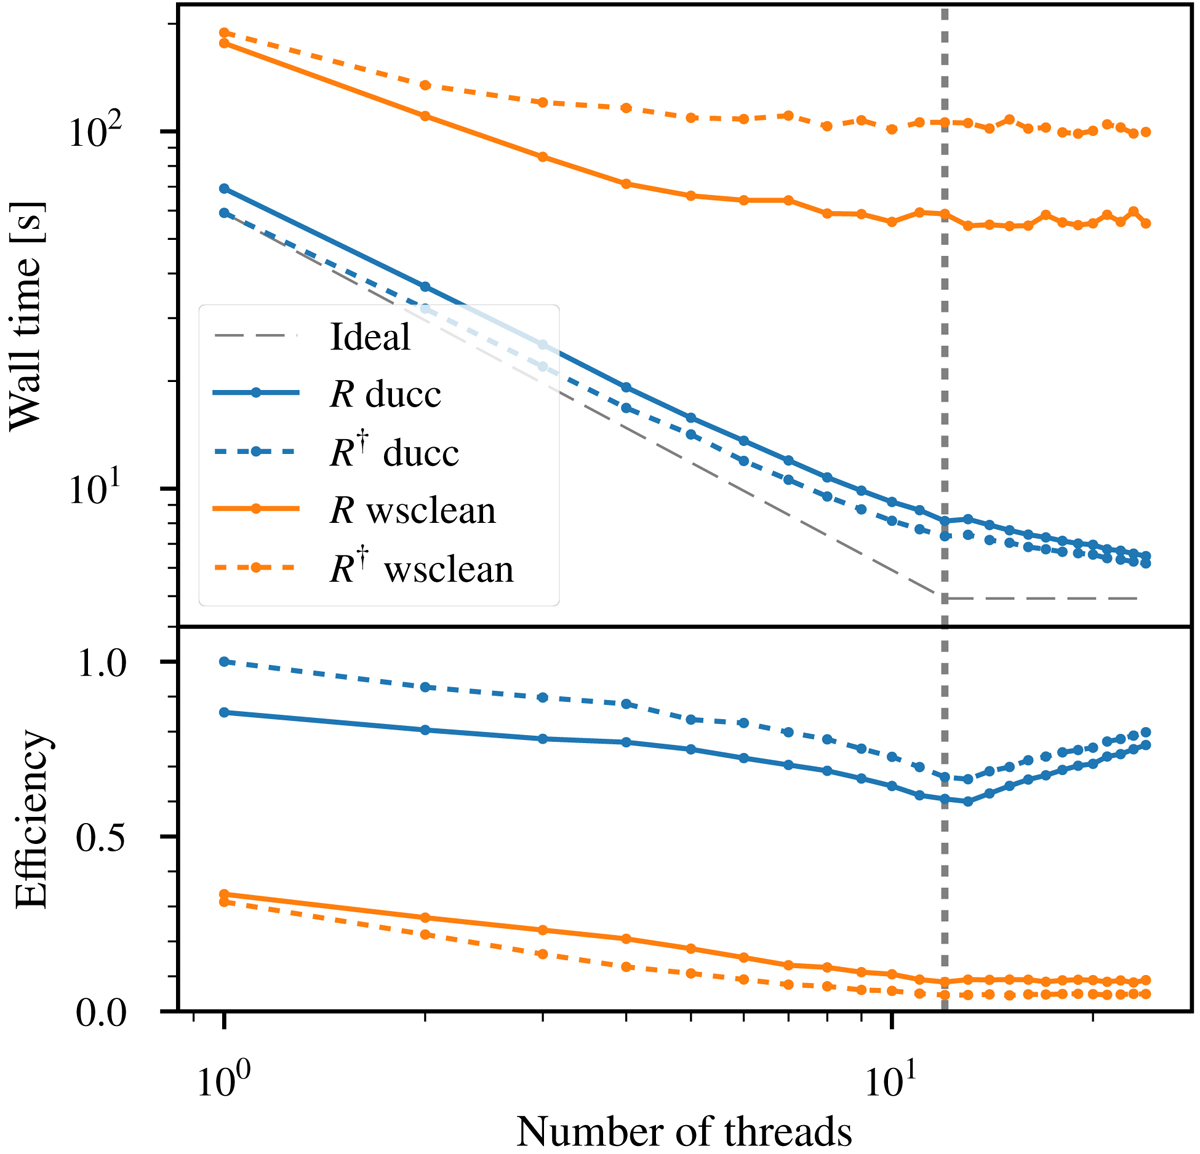
Fig. 6.
Download original image
Strong-scaling scenario. The vertical dotted gray line indicates the number of physical cores on the benchmark machine. Efficiency is the theoretical wall time with perfect scaling divided by the measured wall time and divided by the single-thread timing of ‘R† ducc’.
Current usage metrics show cumulative count of Article Views (full-text article views including HTML views, PDF and ePub downloads, according to the available data) and Abstracts Views on Vision4Press platform.
Data correspond to usage on the plateform after 2015. The current usage metrics is available 48-96 hours after online publication and is updated daily on week days.
Initial download of the metrics may take a while.