Open Access
Fig. 5.
Download original image
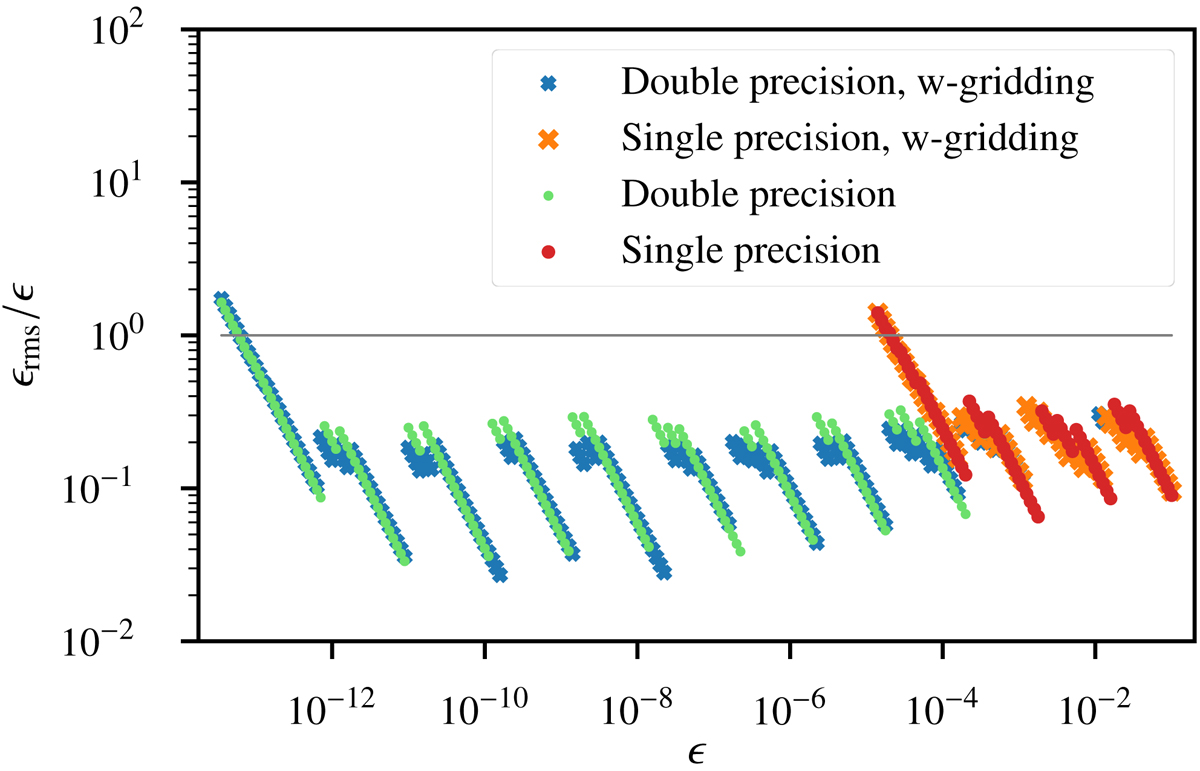
Accuracy of R†. The ratio of measured root mean square error to the requested accuracy ϵ is plotted as a function of ϵ itself. The grey line denotes the identity function. Points lying in the region below the line represent configurations that are more accurate than specified by the user.
Current usage metrics show cumulative count of Article Views (full-text article views including HTML views, PDF and ePub downloads, according to the available data) and Abstracts Views on Vision4Press platform.
Data correspond to usage on the plateform after 2015. The current usage metrics is available 48-96 hours after online publication and is updated daily on week days.
Initial download of the metrics may take a while.