Free Access
Fig. 9
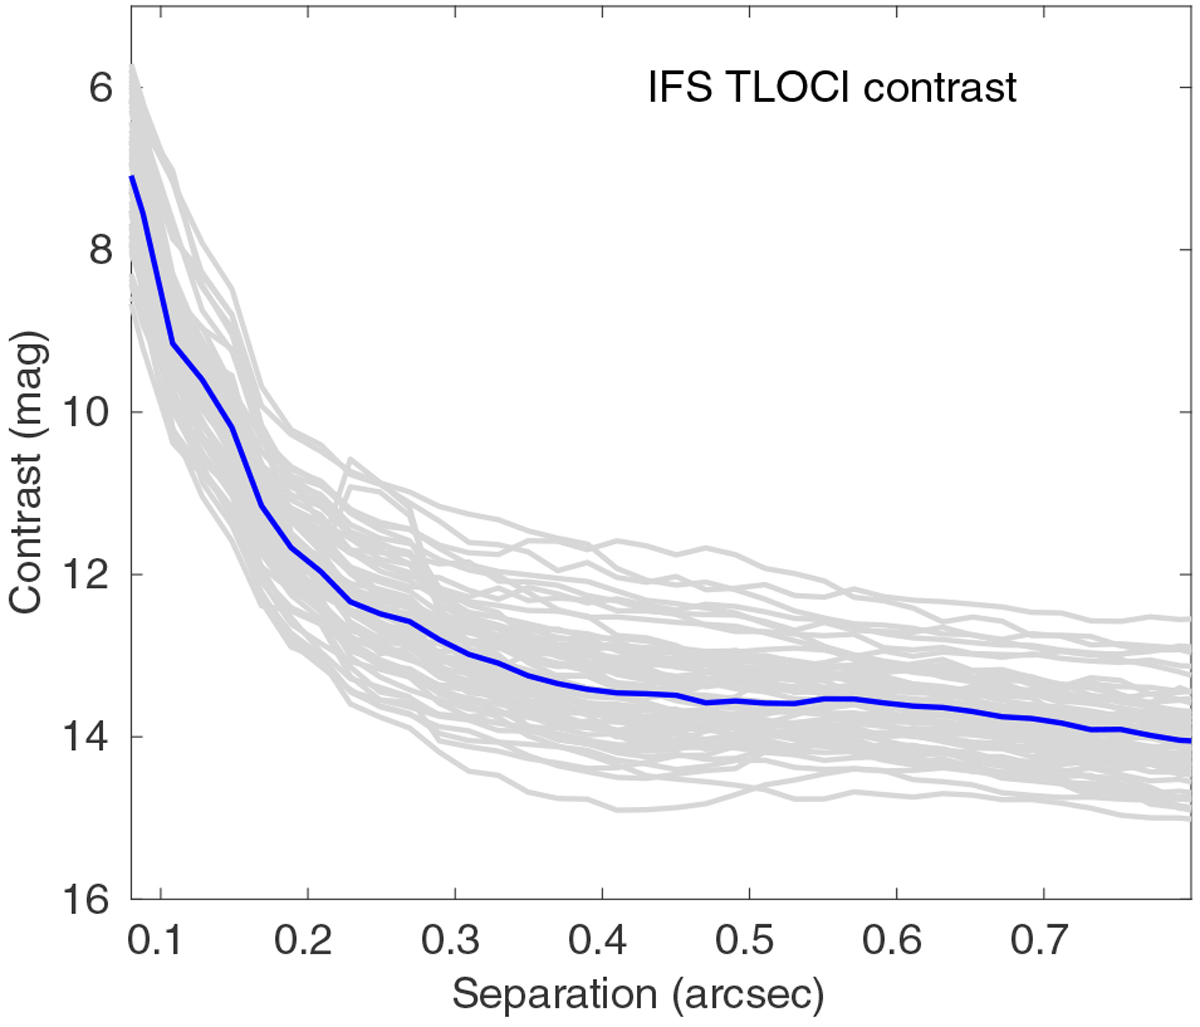
Contrast curves for IFS with the TLOCI reduction. The collapsed images across the accessible wavelength range is used. Grey lines: contrast curves for individual targets. Blue thick line: median contrast curve for the sample.
Current usage metrics show cumulative count of Article Views (full-text article views including HTML views, PDF and ePub downloads, according to the available data) and Abstracts Views on Vision4Press platform.
Data correspond to usage on the plateform after 2015. The current usage metrics is available 48-96 hours after online publication and is updated daily on week days.
Initial download of the metrics may take a while.