Fig. 6
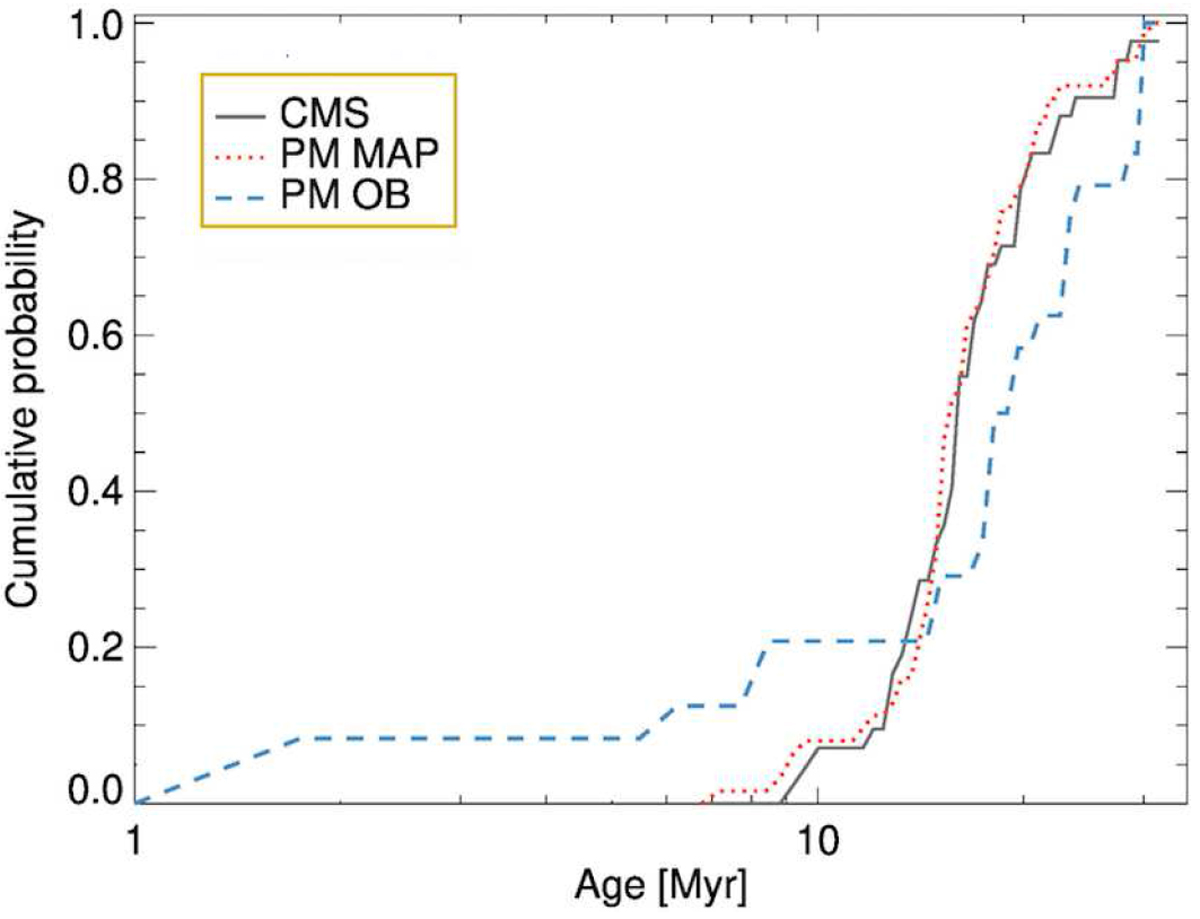
Cumulative distributions for the target ages as estimated through our CMS analysis (black line) and through the Pecaut & Mamajek (2016) age map (red line). The two methods show a high degree of consistency. Also shown as a blue line is the distribution of ages from a direct isochronal analysis for some of the B-type stars in the sample, as determined in Pecaut & Mamajek (2016) based on models from Ekström et al. (2012). This latter method is less precise for a typical star in this sample relative to the other methods, and thus not used in this paper.
Current usage metrics show cumulative count of Article Views (full-text article views including HTML views, PDF and ePub downloads, according to the available data) and Abstracts Views on Vision4Press platform.
Data correspond to usage on the plateform after 2015. The current usage metrics is available 48-96 hours after online publication and is updated daily on week days.
Initial download of the metrics may take a while.