Fig. A.2
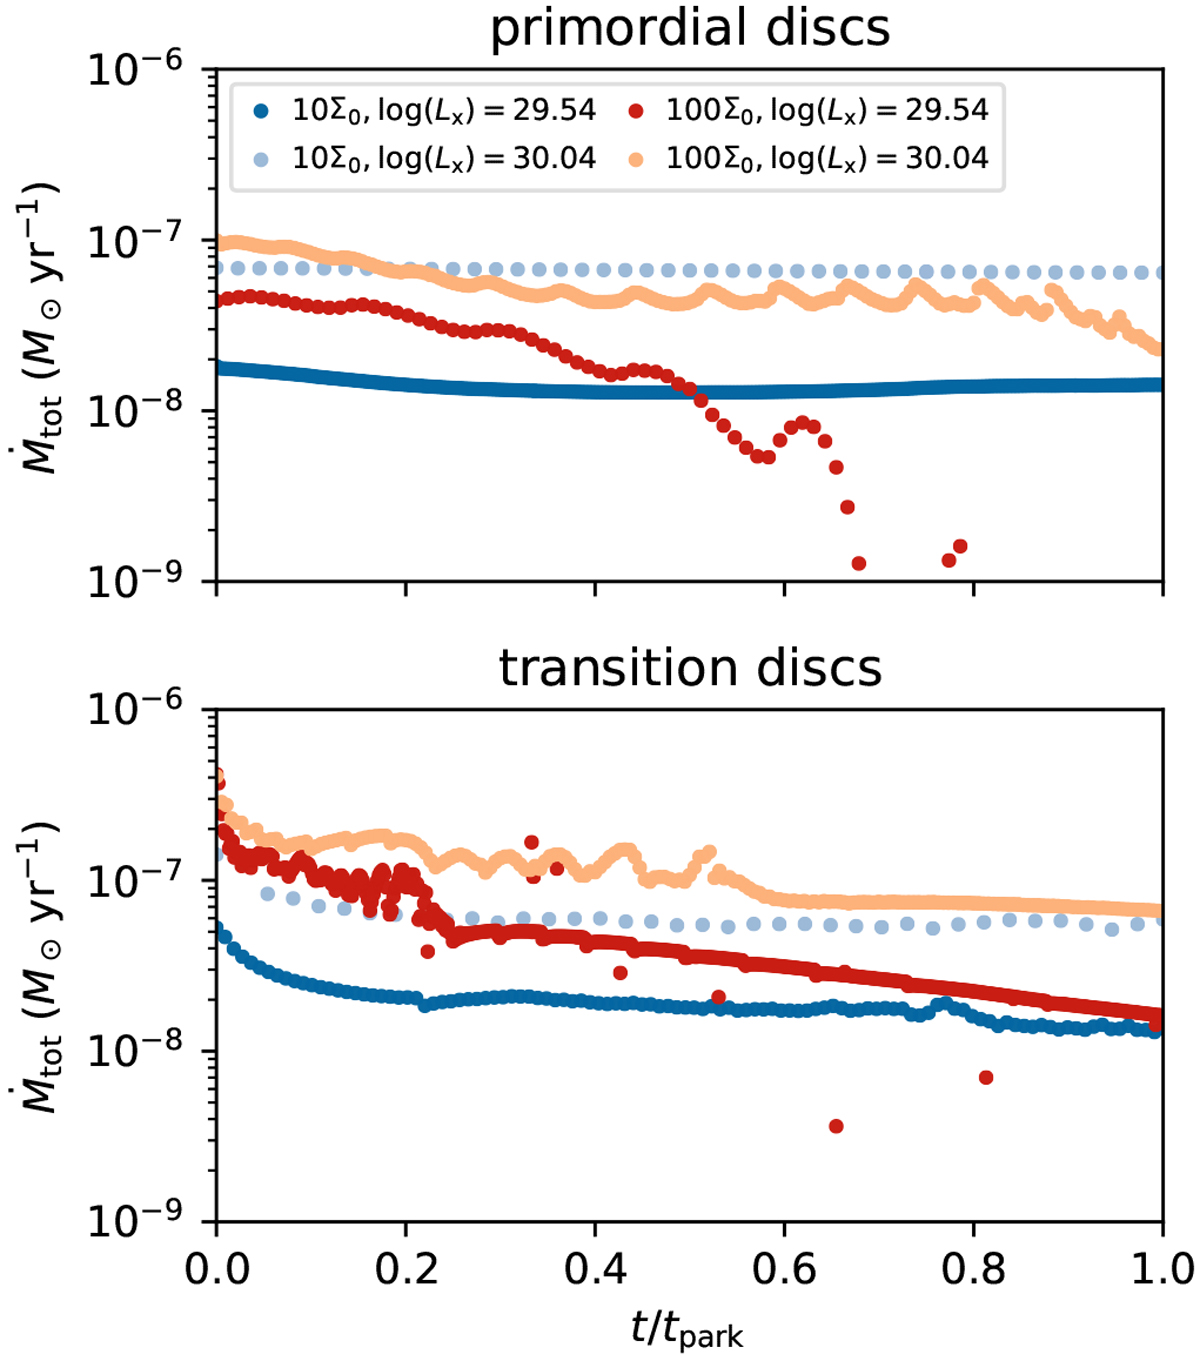
Total mass-loss rate, Ṁ(t), of the discs modelled with FARGO as a function of t∕tpark, where tpark is the time it takes the planet to get parked in each simulation. The lines are plotted starting from the times at which the planet is released and photoevaporation is activated. The total mass-loss rates are averaged over 100 orbits. Top panel: Ṁtot in the primordial discs, while the bottom one corresponds to transition discs.
Current usage metrics show cumulative count of Article Views (full-text article views including HTML views, PDF and ePub downloads, according to the available data) and Abstracts Views on Vision4Press platform.
Data correspond to usage on the plateform after 2015. The current usage metrics is available 48-96 hours after online publication and is updated daily on week days.
Initial download of the metrics may take a while.