Fig. A.1
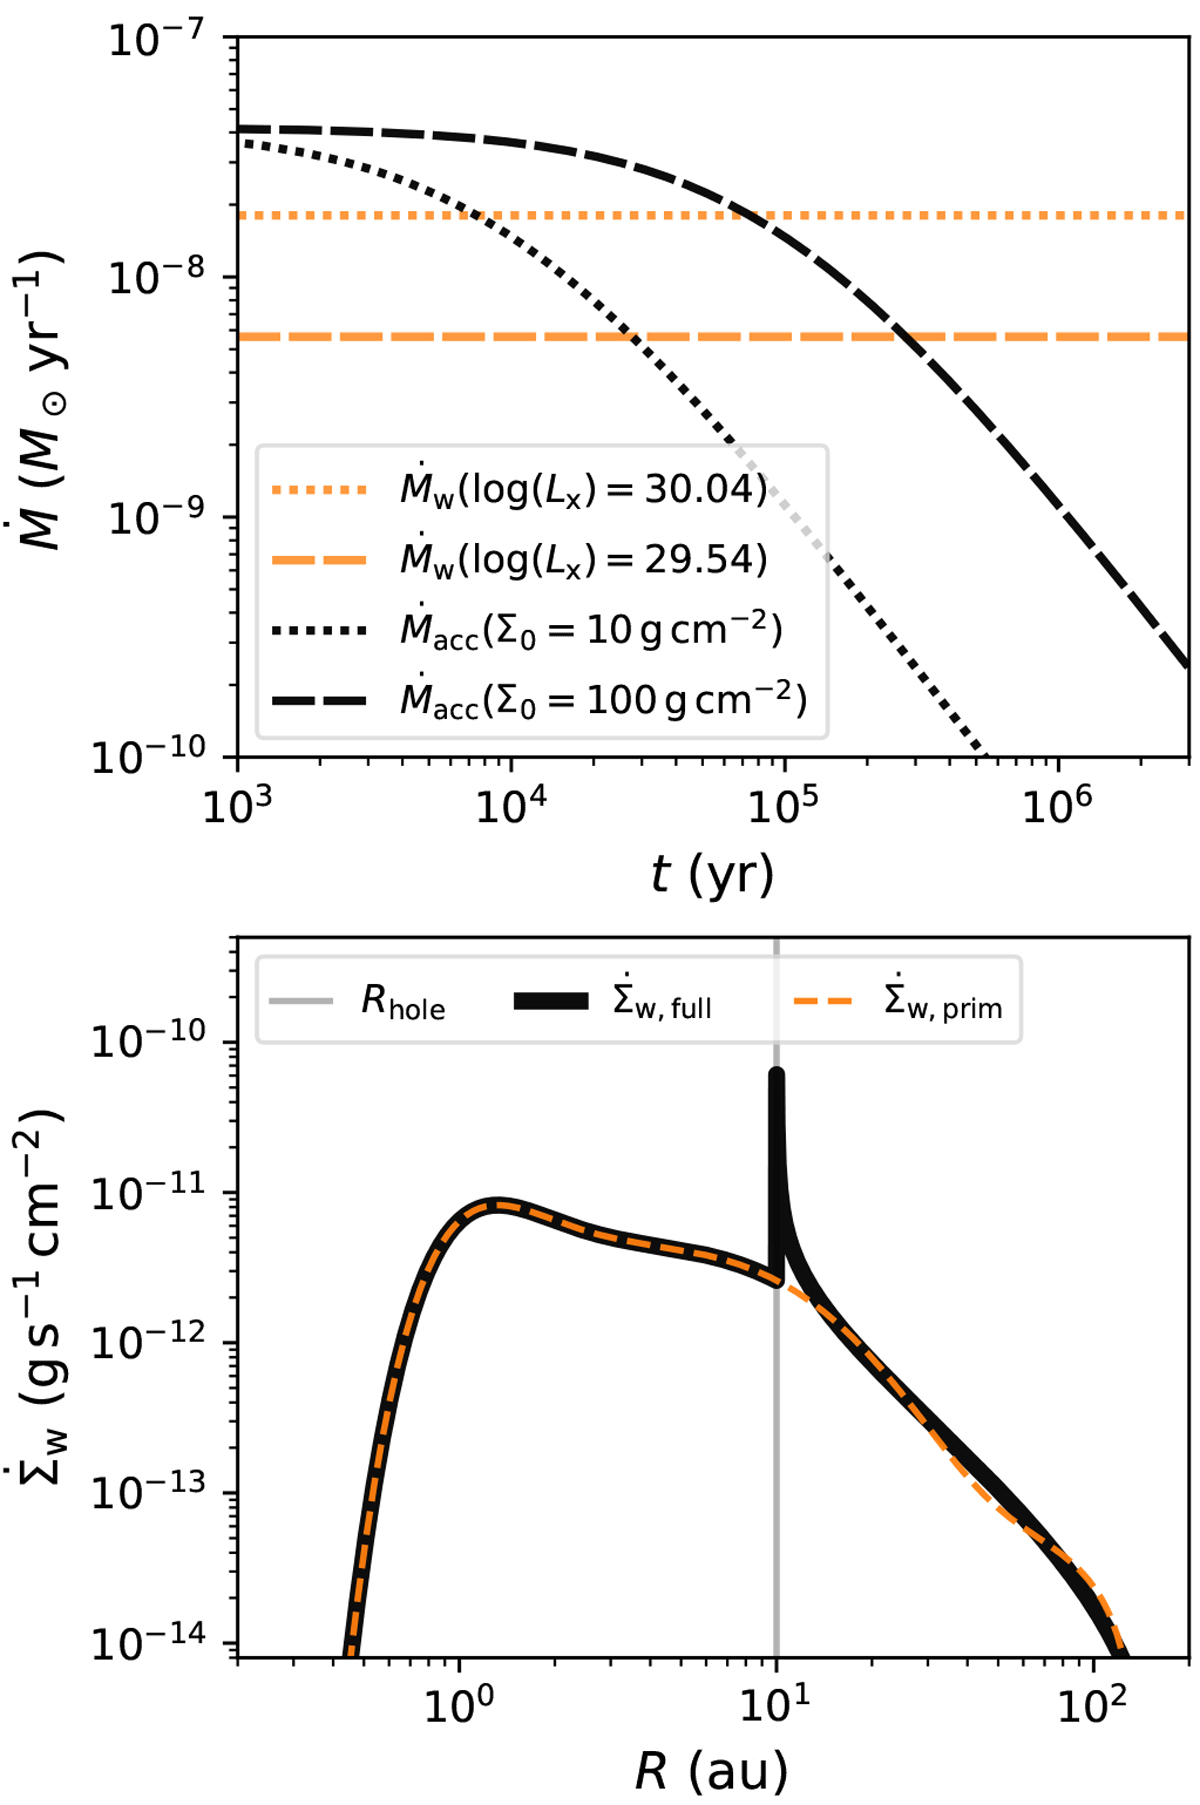
Comparison of the cumulative and surface mass-loss profile as predicted by the XPE model by Picogna et al. (2019) to the purely viscous accretion rate onto the star. Top panel: viscous accretion rate at 1 au of the Σ0 = 10 g cm‒2 and Σ0 = 100 g cm‒2 discs as a function of time (black lines, cf. Eq. (35) in Hartmann et al. 1998) vs. the wind mass-loss rates due to photoevaporation for log10(Lx∕erg s‒1) = 29.54 and log10(Lx∕erg s‒1) = 30.04 (orange lines, cf. Eq. (A.3)). Bottom panel: surface mass-loss profiles as a function of disc radius. The dashed line shows the full contribution of the primordial surface mass-loss profile, which is active before gap opening (Eq. (A.1)). Assuming that photoevaporation has already opened a gap in the disc, with its outer radius Rhole lying at 10 au, and the column density of the inner disc being less than NH = 2.5 × 1022 cm−2, the actual profile that is active is shown as the black solid line.
Current usage metrics show cumulative count of Article Views (full-text article views including HTML views, PDF and ePub downloads, according to the available data) and Abstracts Views on Vision4Press platform.
Data correspond to usage on the plateform after 2015. The current usage metrics is available 48-96 hours after online publication and is updated daily on week days.
Initial download of the metrics may take a while.