Fig. 7
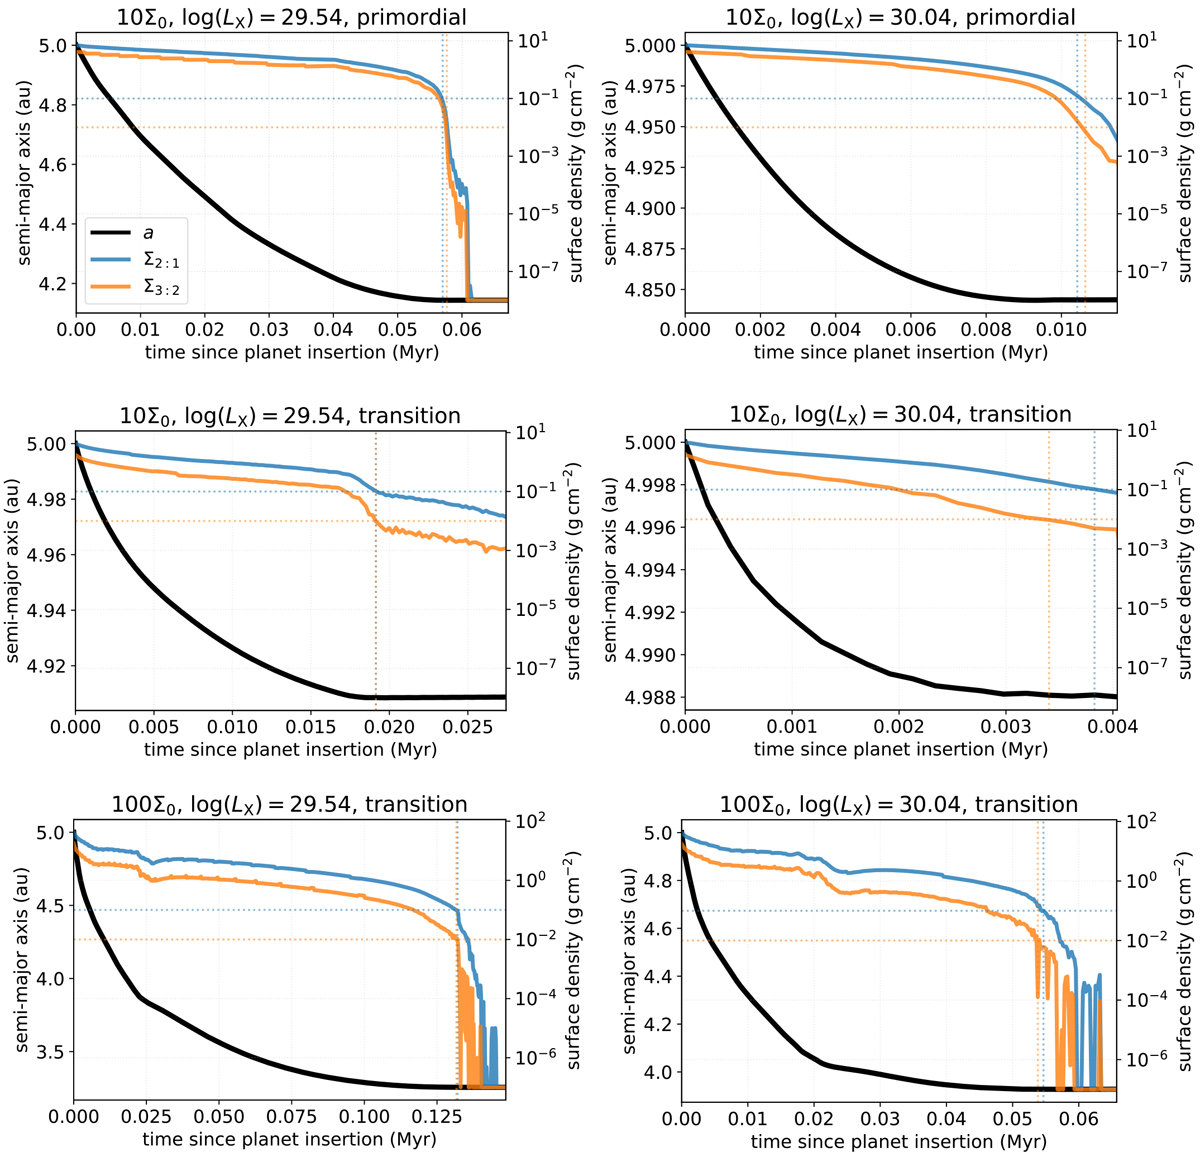
Comparison of the semi-major axis evolution (solid black) in the FARGO simulations vs. the azimuthally averaged surface density at the 2:1 (solid blue) and 3:2 (solid orange) mean motion resonance location in the corresponding disc. Only the runs in which the planet was parked due to planet-disc interactions are shown. The horizontal dotted lines are drawn at Σ2:1 = 10−1 g cm‒2 and Σ3:2 = 10−2 g cm‒2 and cross the corresponding vertical line where the planet is considered to be parked fully.
Current usage metrics show cumulative count of Article Views (full-text article views including HTML views, PDF and ePub downloads, according to the available data) and Abstracts Views on Vision4Press platform.
Data correspond to usage on the plateform after 2015. The current usage metrics is available 48-96 hours after online publication and is updated daily on week days.
Initial download of the metrics may take a while.