Fig. 6
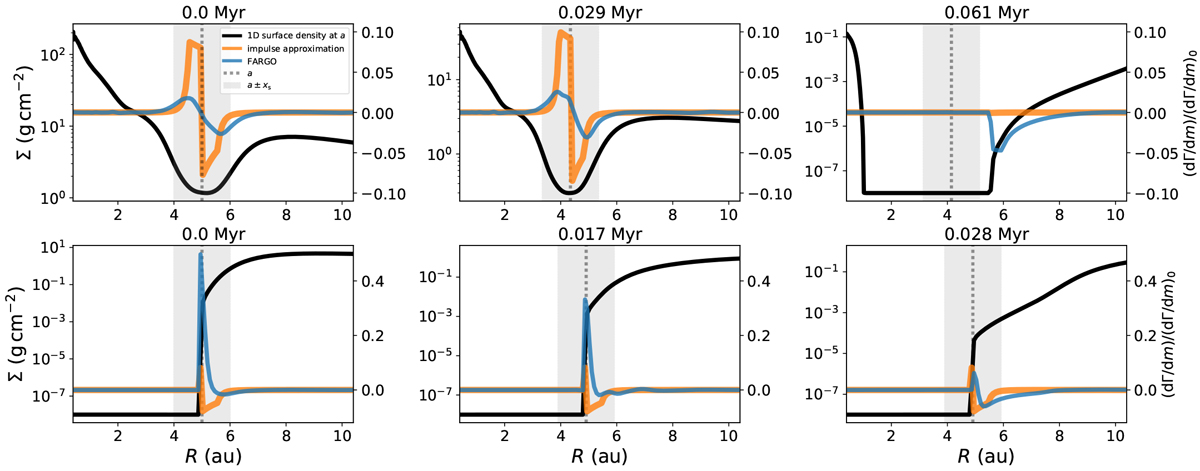
Comparison of the 1D surface density profile (solid black line) of the Σ0 = 10 g cm‒2 and log10(Lx∕erg s‒1) = 29.54 primordial (top panels) and transition disc (bottom panels) with the radial distribution of thetorques per unit disc mass determined from FARGO (blue) and the impulse approximation (orange). The torques were normalised with the normalisation factor ![]() (cf. Eq. (11)). The dotted line shows the planet location at the given timestep, while the shaded area encompassesa ± xs.
(cf. Eq. (11)). The dotted line shows the planet location at the given timestep, while the shaded area encompassesa ± xs.
Current usage metrics show cumulative count of Article Views (full-text article views including HTML views, PDF and ePub downloads, according to the available data) and Abstracts Views on Vision4Press platform.
Data correspond to usage on the plateform after 2015. The current usage metrics is available 48-96 hours after online publication and is updated daily on week days.
Initial download of the metrics may take a while.