Fig. 2
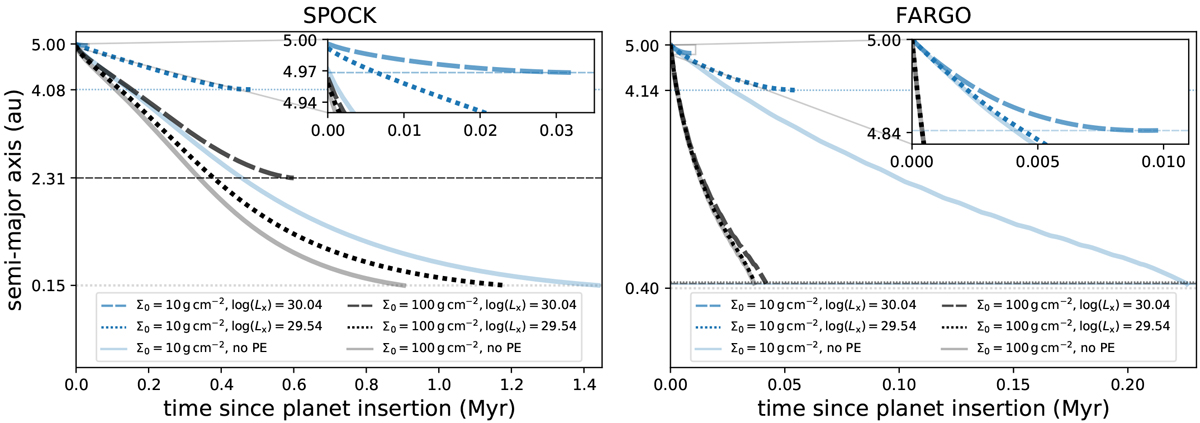
Comparison of the semi-major axis evolution of a 1 MJ planet in theprimordial discs for different X-ray luminosities: log(Lx∕erg s‒1) = 30.04 (dashed), log(Lx∕erg s‒1) = 29.54 (dotted),and vs. no photoevaporation (solid), computed with SPOCK (left panel) and FARGO (right panel). The blue lines correspond to an initial surface density of Σ0 = 10 g cm‒2 and the black lines to Σ0 = 100 g cm‒2. The horizontal lines are drawn at the final planet parking locations. For SPOCK, the simulations are stopped once the planets reach 0.15 au, while for FARGO the inner grid boundary lies at 0.4 au. Upper right panels: zoom into the parameter space to show the evolution of the log (Lx ∕erg s‒1) = 30.04 simulations as their total disc lifetimes are significantly shorter than for the other simulations.
Current usage metrics show cumulative count of Article Views (full-text article views including HTML views, PDF and ePub downloads, according to the available data) and Abstracts Views on Vision4Press platform.
Data correspond to usage on the plateform after 2015. The current usage metrics is available 48-96 hours after online publication and is updated daily on week days.
Initial download of the metrics may take a while.