Fig. C.1
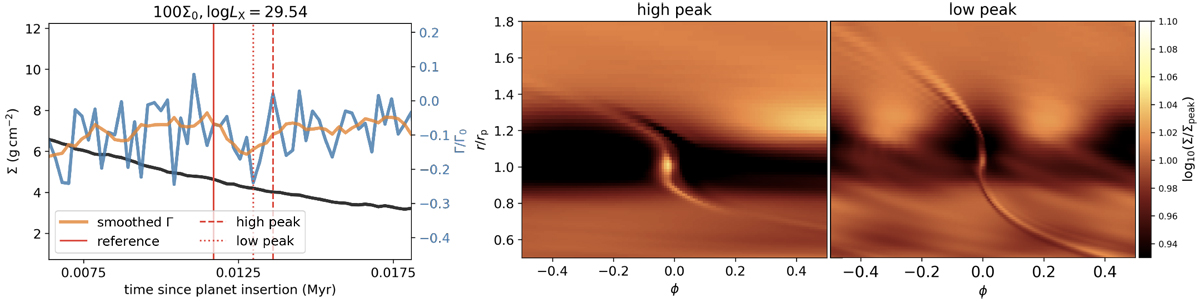
Asymmeteries in the gas surface density close to the planet as a cause for the torque oscillations observed in Fig. 5. Left panel: torque evolution as a function of time for the low X-ray luminosity case. The blue line corresponds to the “raw” torque directly obtained from FARGO, while the orange line shows the smoothed torque using the previously described Savitzky-Golay filter. The black line corresponds to the azimuthally averaged surface density profile at the planet location. The torques were normalised by the normalisation factor Γ0 (cf. Eq. (10)). Right panel: corresponding 2D surface density distribution for the high and low torque peaks with respectto the reference step.
Current usage metrics show cumulative count of Article Views (full-text article views including HTML views, PDF and ePub downloads, according to the available data) and Abstracts Views on Vision4Press platform.
Data correspond to usage on the plateform after 2015. The current usage metrics is available 48-96 hours after online publication and is updated daily on week days.
Initial download of the metrics may take a while.