Fig. 9.
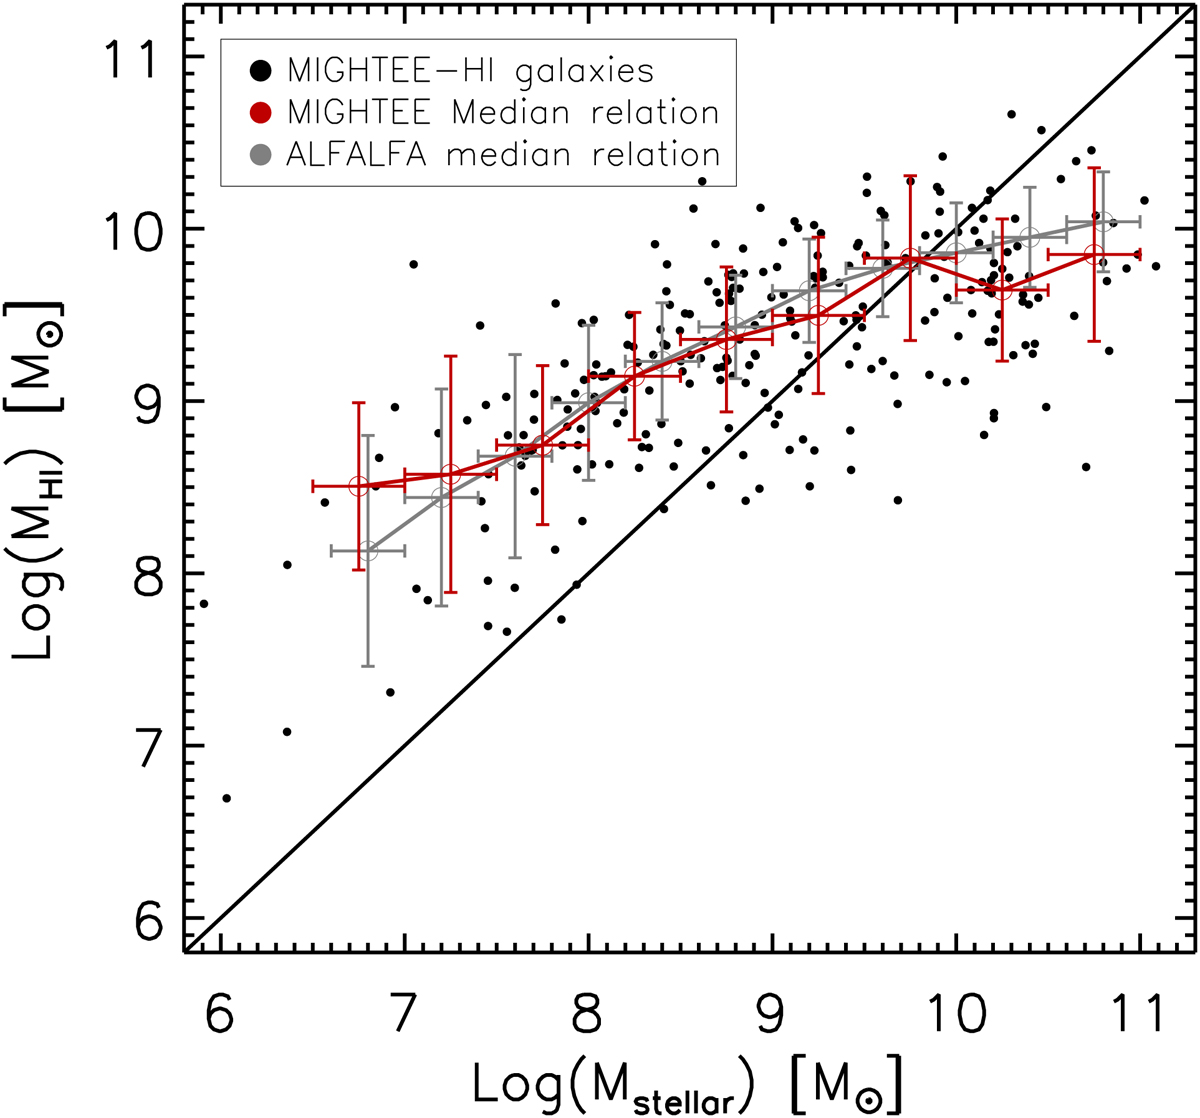
H I masses as a function of stellar mass for MIGHTEE Early Science H I detections, spanning 0 < z < 0.84. Black points mark individual objects. The curved red line indicates the median and 1-σ uncertainty of the relation from the MIGHTEE-HI points, while the grey line is the same relation derived from the ALFALFA survey (Maddox et al. 2015). The horizontal error bars indicate the width of the stellar mass bins.
Current usage metrics show cumulative count of Article Views (full-text article views including HTML views, PDF and ePub downloads, according to the available data) and Abstracts Views on Vision4Press platform.
Data correspond to usage on the plateform after 2015. The current usage metrics is available 48-96 hours after online publication and is updated daily on week days.
Initial download of the metrics may take a while.