Fig. 8.
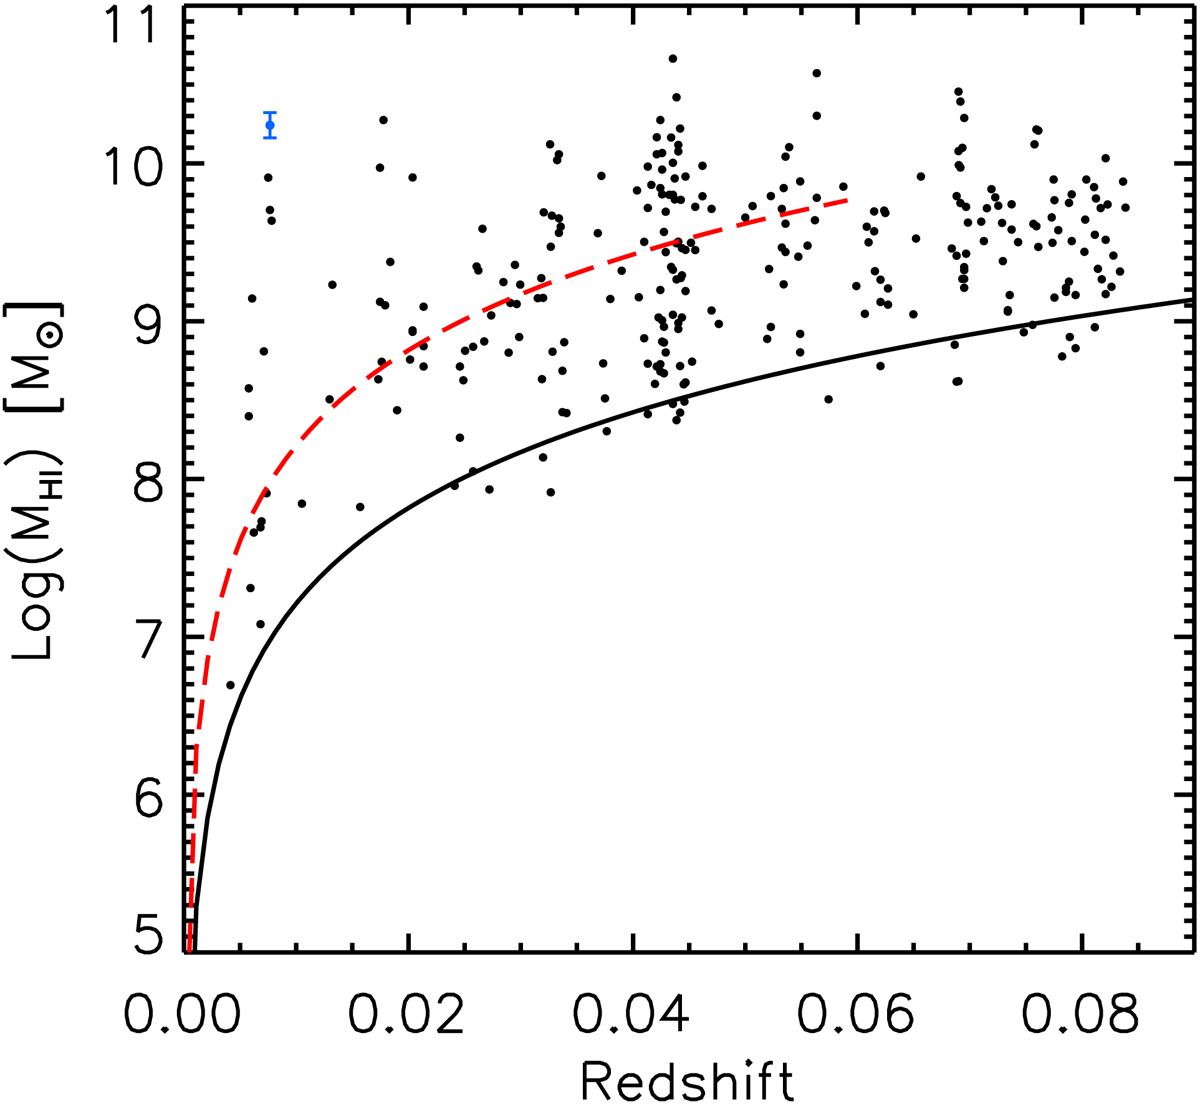
H I masses as a function of redshift for the Early Science H I detections. Black points mark individual objects, while the curved black line indicates the 5-σ flux limit used for the simulations. An estimate of the uncertainty on the H I masses is illustrated for the blue point with error bars in the top left corner. The red dashed line is the approximate flux limit of the ALFALFA survey, which does not extend beyond z ∼ 0.06. MIGHTEE-HI Early Science detections are found all the way to the upper redshift limit of z = 0.084.
Current usage metrics show cumulative count of Article Views (full-text article views including HTML views, PDF and ePub downloads, according to the available data) and Abstracts Views on Vision4Press platform.
Data correspond to usage on the plateform after 2015. The current usage metrics is available 48-96 hours after online publication and is updated daily on week days.
Initial download of the metrics may take a while.