Free Access
Fig. 5.
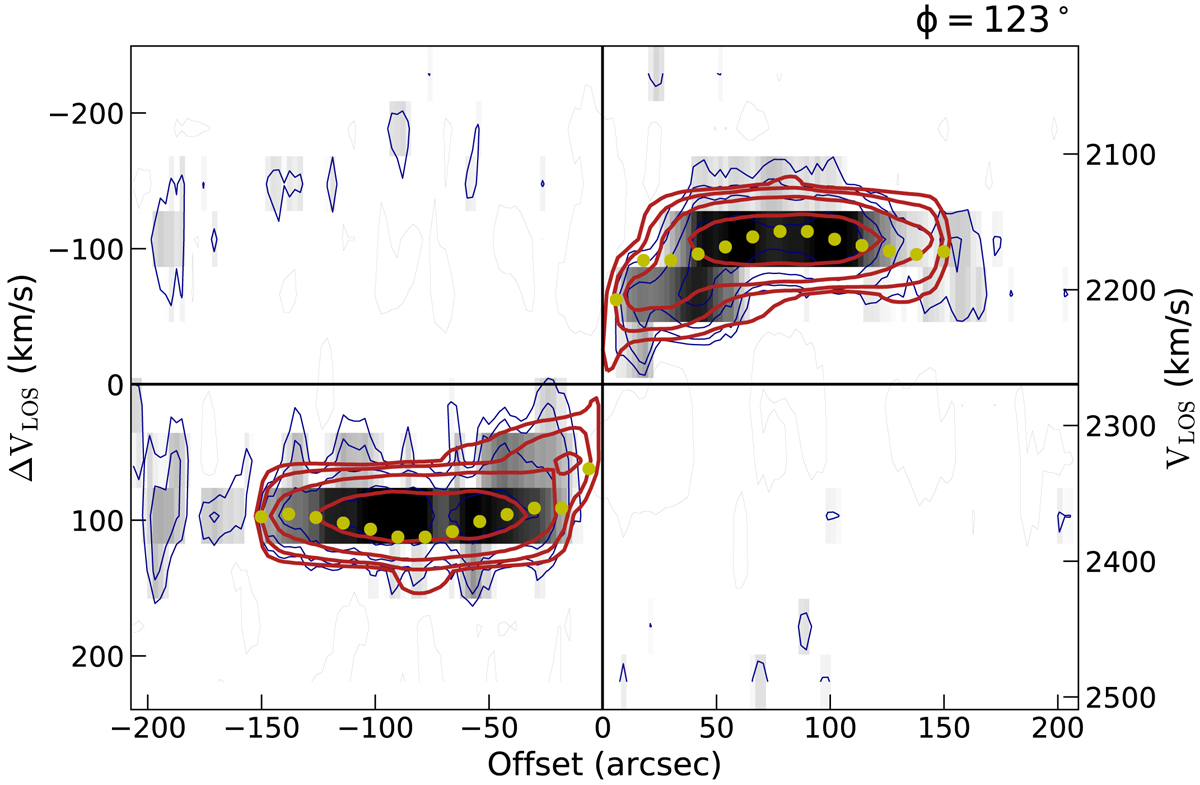
Position-velocity diagram of NGC 895, using H I data from MIGHTEE-HI, is shown in grey scale and blue contours. The 3D kinematic model made with 3DBarolo (Di Teodoro & Fraternali 2015) is shown with red contours, and the resulting rotation curve of the galaxy, projected on the data, is shown with yellow dots.
Current usage metrics show cumulative count of Article Views (full-text article views including HTML views, PDF and ePub downloads, according to the available data) and Abstracts Views on Vision4Press platform.
Data correspond to usage on the plateform after 2015. The current usage metrics is available 48-96 hours after online publication and is updated daily on week days.
Initial download of the metrics may take a while.