Fig. 4.
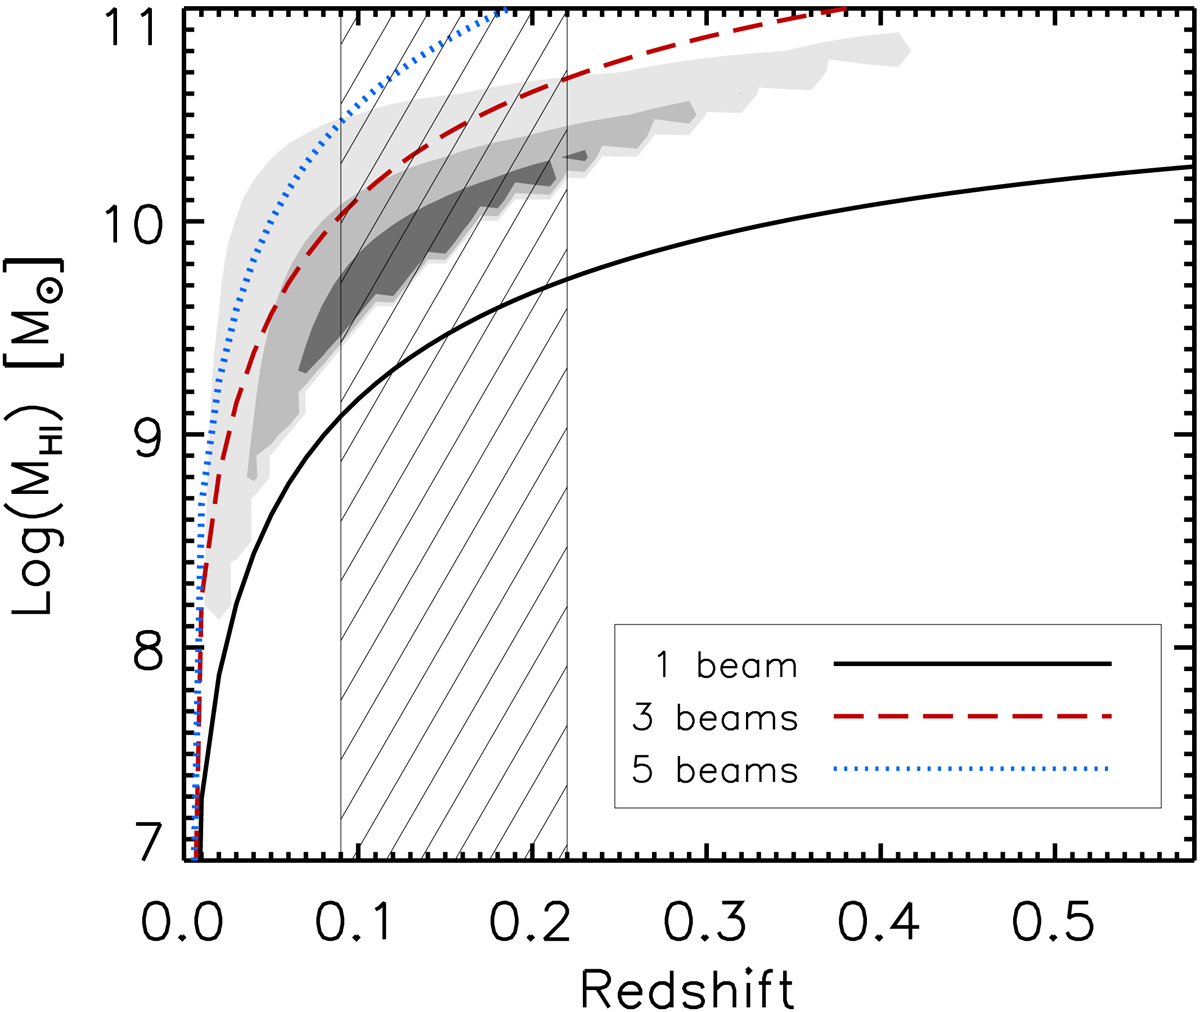
MHI – redshift parameter space, showing where MIGHTEE-HI is sensitive to galaxies, divided into cells of size Δz = 0.01 and Δ log(MHI) = 0.1. Light, medium, and dark grey shading indicates where at least one, 10, and 25 galaxies are expected per cell. The black, red, and blue curves correspond to the MHI of galaxies as a function of redshift, for three fixed diameters, using the MHI – DHI relation from Wang et al. (2016). The black line shows the 12 arcsec MeerKAT beam, indicating galaxies below this mass will be unresolved. The red dashed line is for marginally resolved sources and the blue dashed line is for well-resolved sources with five beams across. 0.09 < z < 0.22 is worst-afftected by RFI, and the size and shape of the synthesised beam is strongly affected in this region.
Current usage metrics show cumulative count of Article Views (full-text article views including HTML views, PDF and ePub downloads, according to the available data) and Abstracts Views on Vision4Press platform.
Data correspond to usage on the plateform after 2015. The current usage metrics is available 48-96 hours after online publication and is updated daily on week days.
Initial download of the metrics may take a while.