Fig. 3.
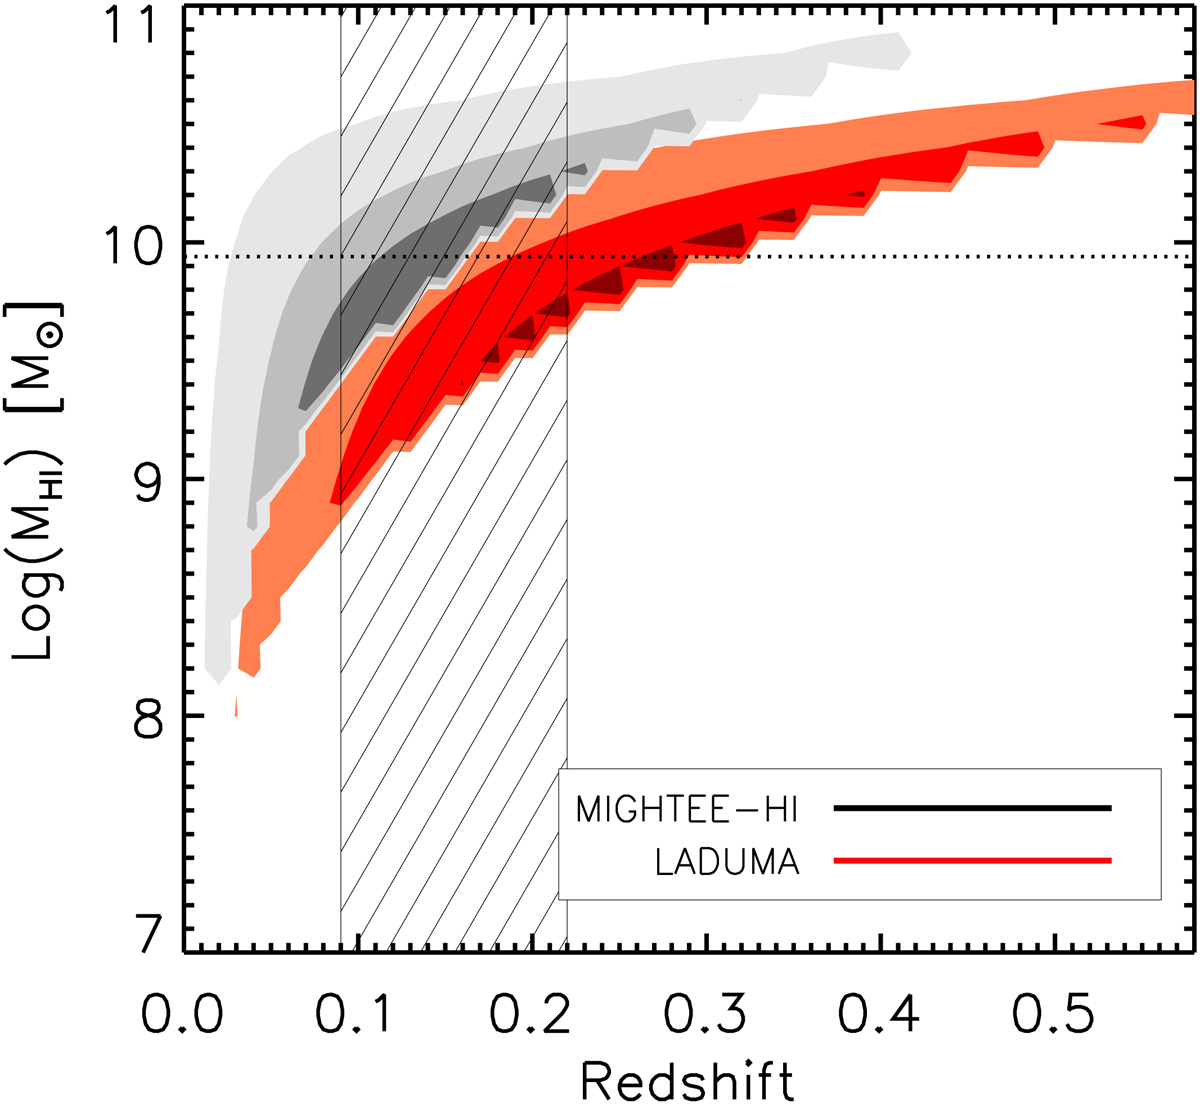
MHI – redshift parameter space, showing where MIGHTEE-HI and LADUMA are sensitive to galaxies, divided into cells of size Δz = 0.01 and Δ log(MHI) = 0.1. Light, medium, and dark grey shading indicates where at least one, 10, and 25 galaxies are expected per cell. Light, medium, and dark red shading shows where at least one, four, and eight galaxies are expected per cell. The horizontal dotted line indicates the z = 0 characteristic H I mass from the HIMF. The hatched region corresponds to the redshift range 0.09 < z < 0.22 most affected by RFI.
Current usage metrics show cumulative count of Article Views (full-text article views including HTML views, PDF and ePub downloads, according to the available data) and Abstracts Views on Vision4Press platform.
Data correspond to usage on the plateform after 2015. The current usage metrics is available 48-96 hours after online publication and is updated daily on week days.
Initial download of the metrics may take a while.