Fig. 1.
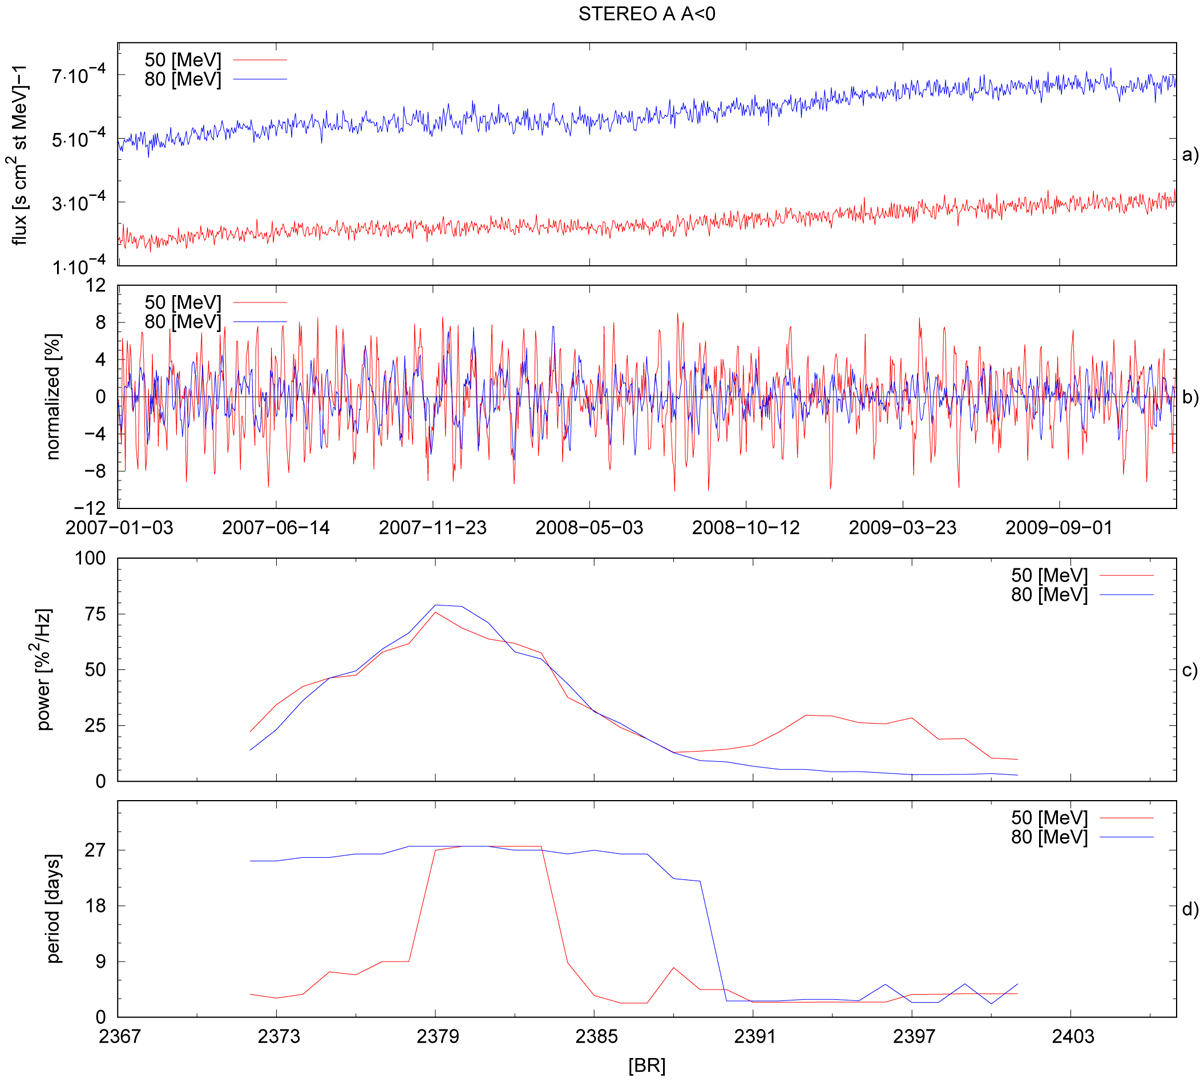
Panel a: STEREO A daily proton fluxes for a kinetic energy 40–60 MeV and 60–100 MeV for the solar minimum 23/24 when A < 0 in 2007–2009. Panel b: GCR intensity normalized and detrended by excluding the 29-day running average, the time line of the power of recurrent variations lasting 25–29 days (panel c), and the recognized main period (panel d).
Current usage metrics show cumulative count of Article Views (full-text article views including HTML views, PDF and ePub downloads, according to the available data) and Abstracts Views on Vision4Press platform.
Data correspond to usage on the plateform after 2015. The current usage metrics is available 48-96 hours after online publication and is updated daily on week days.
Initial download of the metrics may take a while.