Fig. 1.
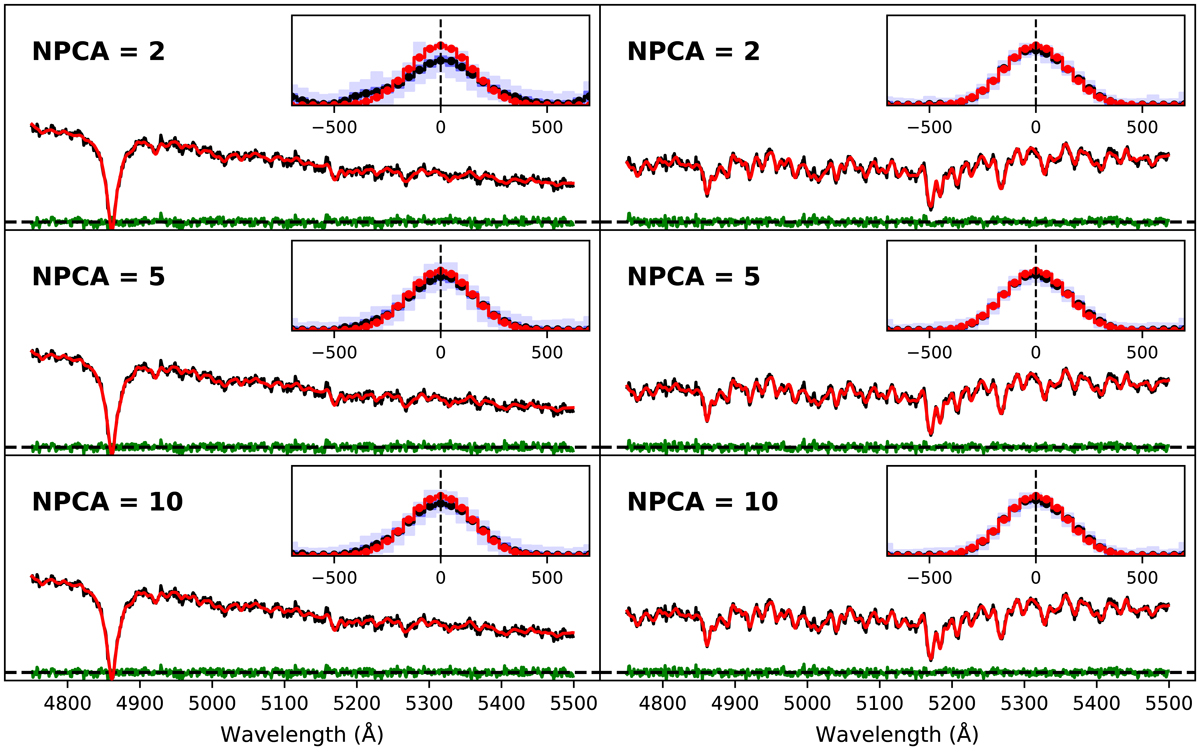
Comparison of spectral fitting quality and LOSVD recovery for different numbers of PCA components. Each column presents input spectra with different stellar populations (young and old on the left and the right respectively). The input spectra have a S/N of 50 per pixel. All panels are plotted on the same scale. The black lines on the main panels are the input test data, while the red line shows the best fitting model. Residuals are indicated in green. The spectral fits are carried out with 2, 5, and 10 PCA templates (from top to bottom as indicated). In the insets, the input LOSVD is a Gaussian centred at zero and a velocity dispersion of 150 km s−1 (indicated in red). Units of the abscissae in the insets are km s−1. The recovered median values of the LOSVDs are indicated with a thick black line. 16%−84% and 1%−99% confidence limits at each point are indicated in dark and light blue, respectively. An order 2 auto-regressive prior was used to perform the fitting (see Sect. 2.4 for details).
Current usage metrics show cumulative count of Article Views (full-text article views including HTML views, PDF and ePub downloads, according to the available data) and Abstracts Views on Vision4Press platform.
Data correspond to usage on the plateform after 2015. The current usage metrics is available 48-96 hours after online publication and is updated daily on week days.
Initial download of the metrics may take a while.