Fig. 8
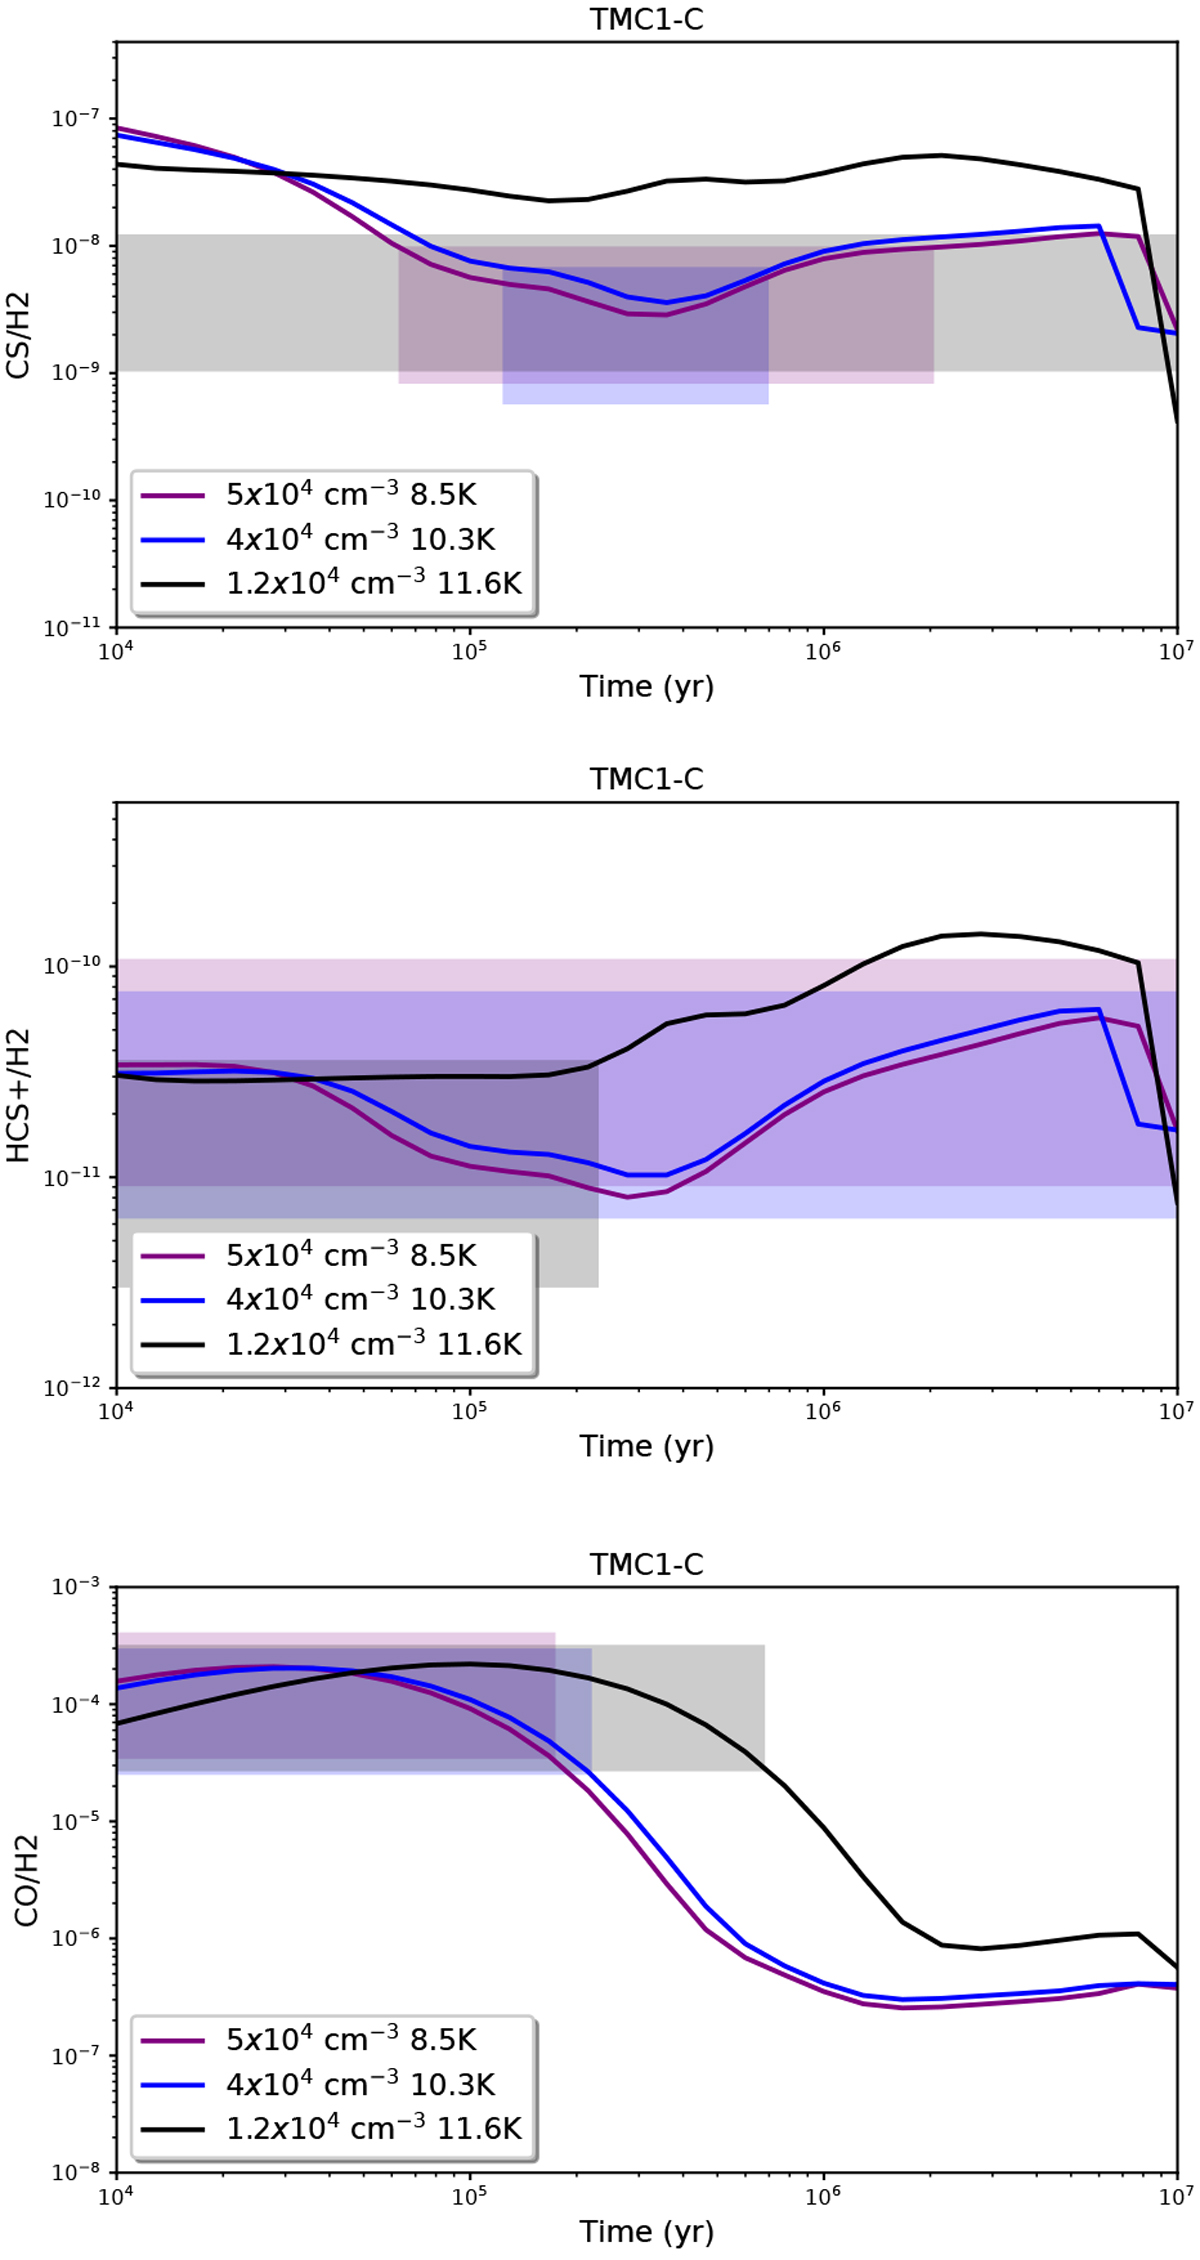
Predicted abundances of gas-phase CS, HCS+, and CO withrespect to H2 as a function of time. The curves correspond to the different physical conditions observed in the TMC1-C source with ![]() = 10−16 s−1. Each curve (density) corresponds to a different position of Table 3 in Fuente et al. (2019). Colored boxes represent the agreement with the observations. The abundance of S with respect to H is depleted by a factor of 20 relative to the cosmic value.
= 10−16 s−1. Each curve (density) corresponds to a different position of Table 3 in Fuente et al. (2019). Colored boxes represent the agreement with the observations. The abundance of S with respect to H is depleted by a factor of 20 relative to the cosmic value.
Current usage metrics show cumulative count of Article Views (full-text article views including HTML views, PDF and ePub downloads, according to the available data) and Abstracts Views on Vision4Press platform.
Data correspond to usage on the plateform after 2015. The current usage metrics is available 48-96 hours after online publication and is updated daily on week days.
Initial download of the metrics may take a while.