Fig. 9.
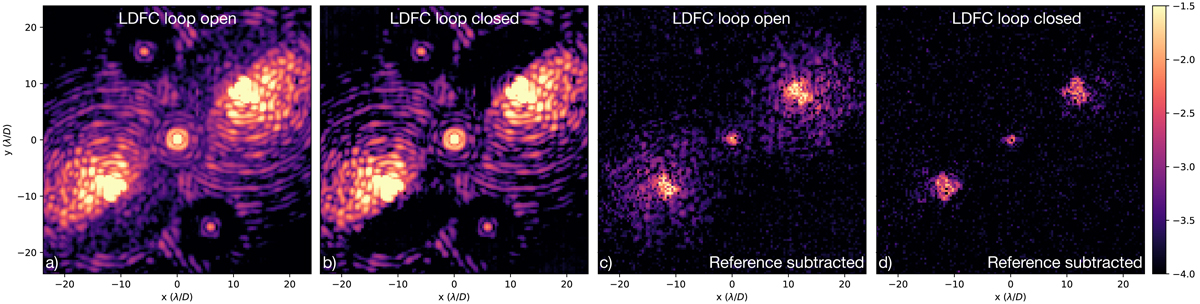
Averages of 10 000 images that show the resulting coronagraphic PSFs when the LDFC loop is closed and open. (a) Average PSF when the LDFC loop is open. (b) Average PSF when the LDFC loop is closed. (c) Average PSF when the LDFC loop is open and the reference PSF is subtracted. (d) Average PSF when the LDFC loop is closed and the reference PSF is subtracted. The colorbar shows the normalized intensity in logarithmic scale and is equal for all subfigures.
Current usage metrics show cumulative count of Article Views (full-text article views including HTML views, PDF and ePub downloads, according to the available data) and Abstracts Views on Vision4Press platform.
Data correspond to usage on the plateform after 2015. The current usage metrics is available 48-96 hours after online publication and is updated daily on week days.
Initial download of the metrics may take a while.