Fig. 7.
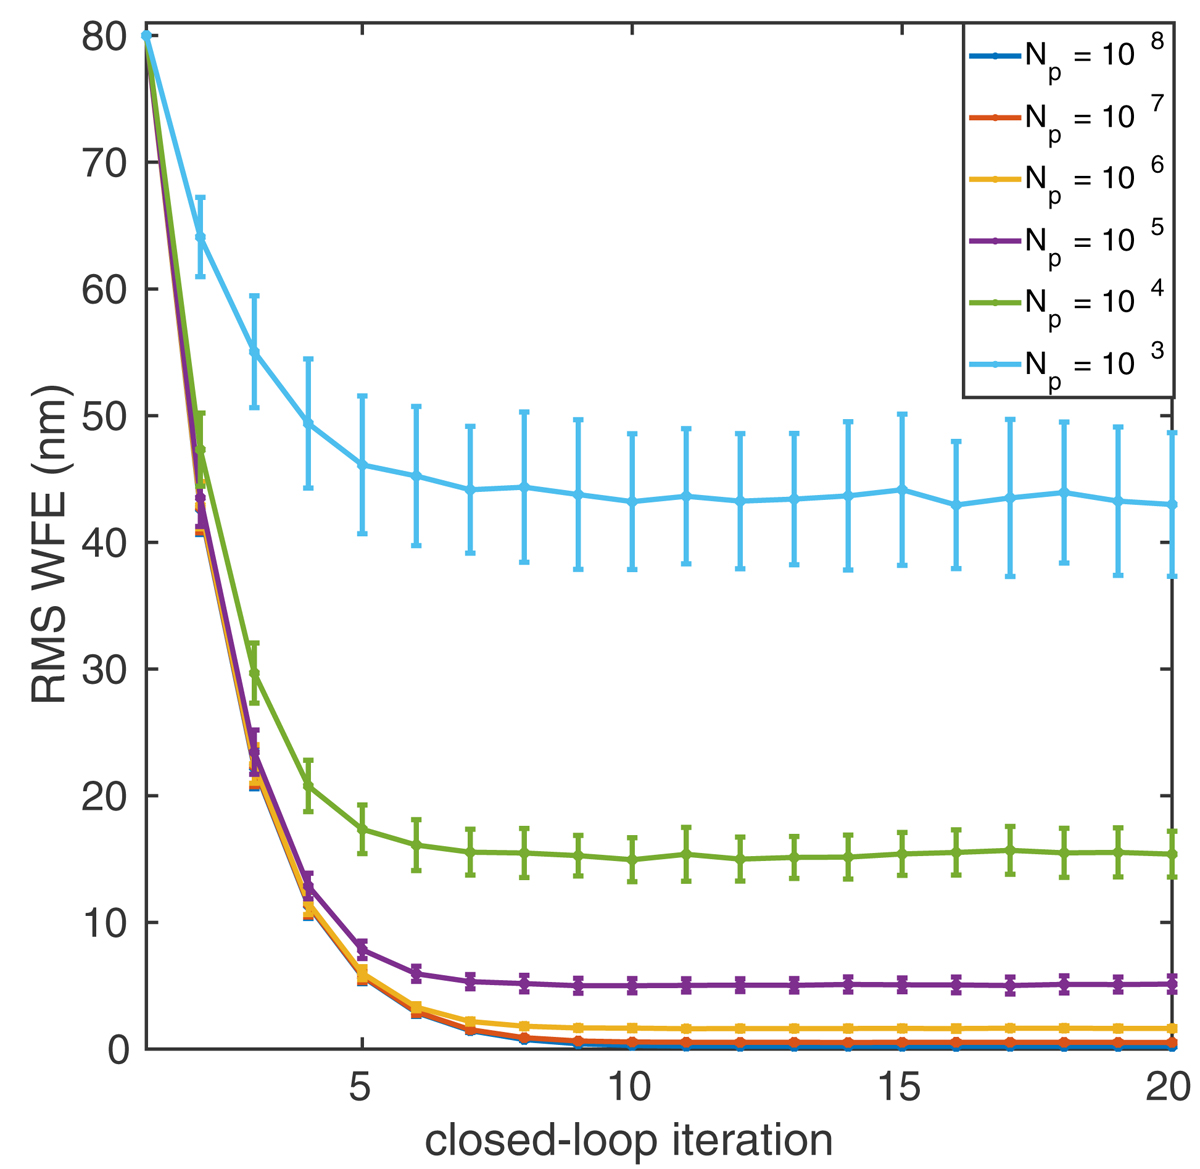
Closed-loop performance for each Np level showing the average residual rms WFE over all 100 randomly generated aberrations vs loop iteration. The error bars give the standard deviation of the average residual rms WFE at each loop iteration across the set of 100 random aberrations. As expected, as Np increases, the average residual rms WFE, as well as the stand deviation from the mean, decreases. For values of Np between 108 and 106, the rms WFE converges to ≤1 nm.
Current usage metrics show cumulative count of Article Views (full-text article views including HTML views, PDF and ePub downloads, according to the available data) and Abstracts Views on Vision4Press platform.
Data correspond to usage on the plateform after 2015. The current usage metrics is available 48-96 hours after online publication and is updated daily on week days.
Initial download of the metrics may take a while.