Fig. 10.
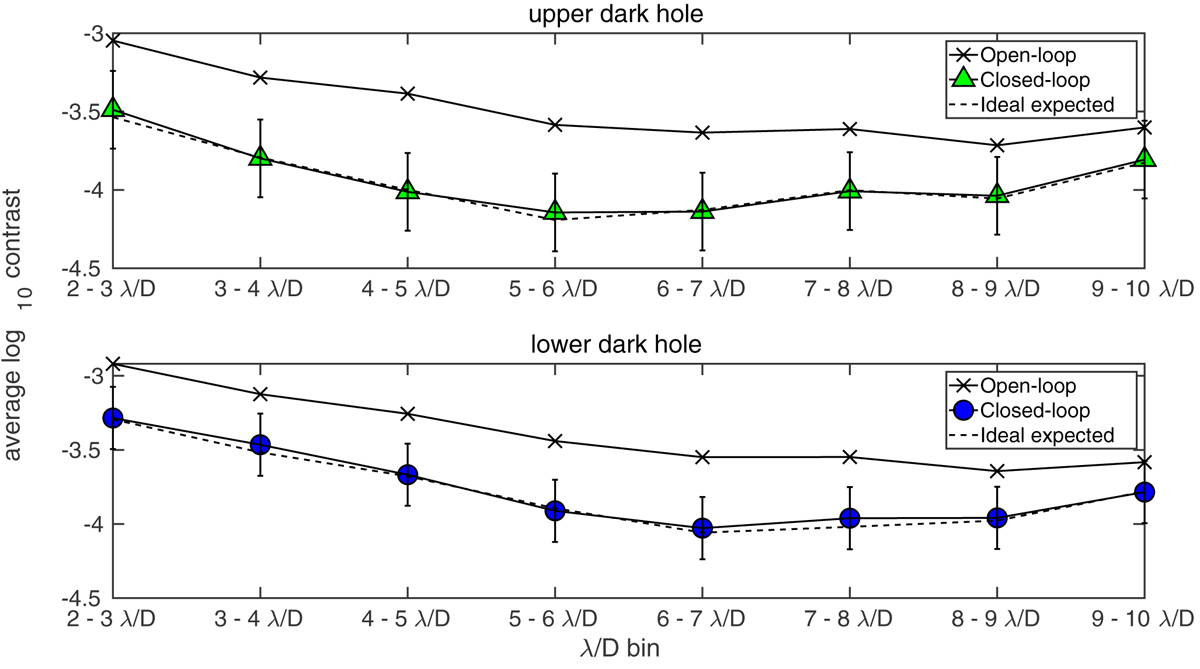
Average contrast over the full 10 000 iterations calculated for each 1 λ/D hemispherical bin in both the upper and lower dark holes. The plots show the average contrast per spatial frequency bin in the aberrated open-loop state, post-LDFC correction in closed-loop, and the ideal contrast measurement expected from the reference image. Error bars are given for the closed-loop LDFC contrast measurements denoting the standard deviation of the contrast measured in each 1 λ/D bin for the full 10 000 iterations. This plot clearly shows that running LDFC in closed-loop drives the dark hole contrast back to its initial state as measured in the reference image.
Current usage metrics show cumulative count of Article Views (full-text article views including HTML views, PDF and ePub downloads, according to the available data) and Abstracts Views on Vision4Press platform.
Data correspond to usage on the plateform after 2015. The current usage metrics is available 48-96 hours after online publication and is updated daily on week days.
Initial download of the metrics may take a while.