Fig. 7.
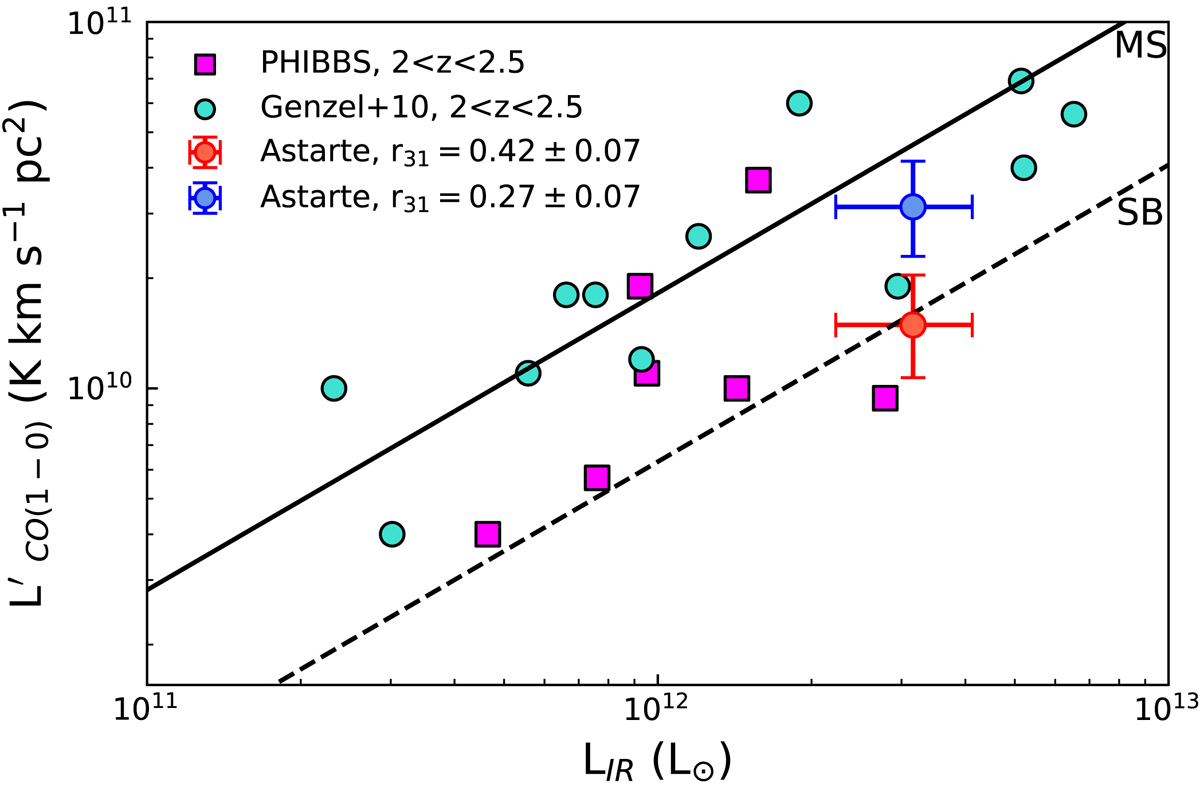
Correlation between CO(1–0) luminosities and the total IR luminosity. The filled magenta squares are from T13 and filled turquoise circles are the sources from G10. The solid black line is the linear regression for MS galaxies (Sargent et al. 2014), and the dashed line is that for SBs (the regression lines are from the complete sample in Sargent et al. 2014).
Current usage metrics show cumulative count of Article Views (full-text article views including HTML views, PDF and ePub downloads, according to the available data) and Abstracts Views on Vision4Press platform.
Data correspond to usage on the plateform after 2015. The current usage metrics is available 48-96 hours after online publication and is updated daily on week days.
Initial download of the metrics may take a while.