Fig. 3.
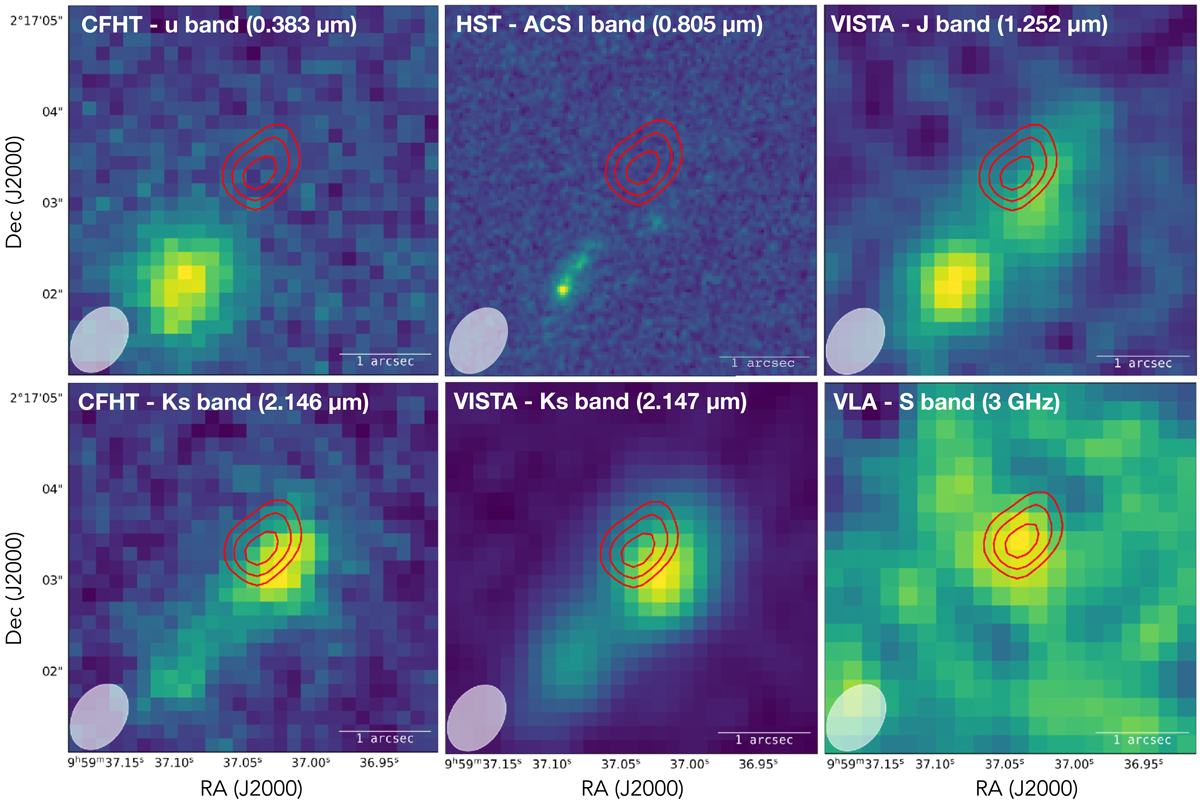
ALMA-detected CO(3–2) emission line contour map (red contours) of Astarte overlaid on detections from different telescopes and instruments at different bands as specified in every panel. From upper left to lower right: CFHT U band at 0.383 μm. HST I band at 0.805 μm. VISTA J band at 1.252 μm. CFHT Ks band at 2.146 μm. VISTA Ks band at 2.147 μm and for the VLA detection at 3 GHz. The outermost contour is 3σ, and the subsequent contours are in steps of 1σ with red innermost contour showing 5σ. The beam size is 0.78″ × 0.50″. The white bar shows the 1 arcsec scale.
Current usage metrics show cumulative count of Article Views (full-text article views including HTML views, PDF and ePub downloads, according to the available data) and Abstracts Views on Vision4Press platform.
Data correspond to usage on the plateform after 2015. The current usage metrics is available 48-96 hours after online publication and is updated daily on week days.
Initial download of the metrics may take a while.