Fig. 9.
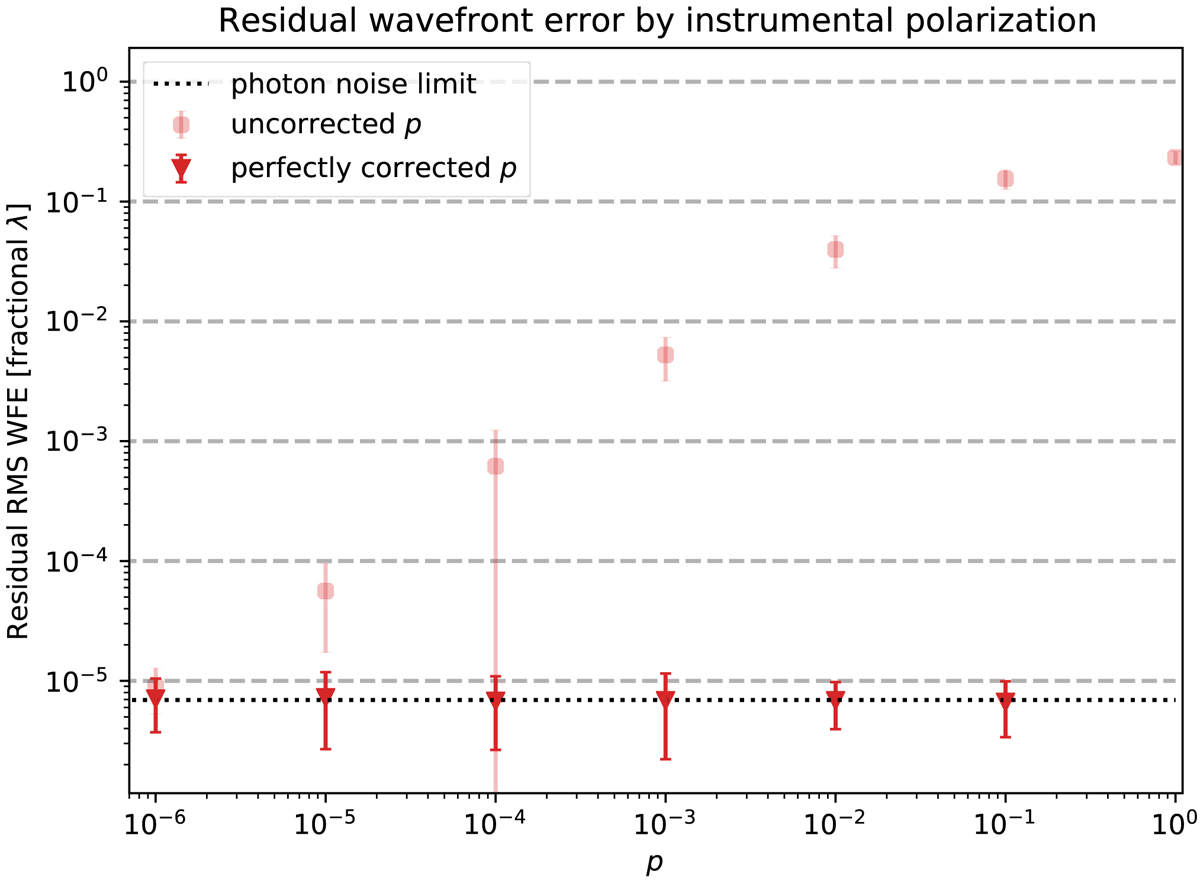
Performance of the wavefront sensing with instrumental polarization effects. The error bars show the 1σ deviation over the 100 random wavefront aberration instances. The circles show that data points where the strength of instrumental polarization (p) was not corrected and the triangles show the data points where p was corrected. The dotted lines shows the photon noise limit, which was introduced to prevent the residual wavefront error reaching numerical noise.
Current usage metrics show cumulative count of Article Views (full-text article views including HTML views, PDF and ePub downloads, according to the available data) and Abstracts Views on Vision4Press platform.
Data correspond to usage on the plateform after 2015. The current usage metrics is available 48-96 hours after online publication and is updated daily on week days.
Initial download of the metrics may take a while.