Free Access
Fig. 21.
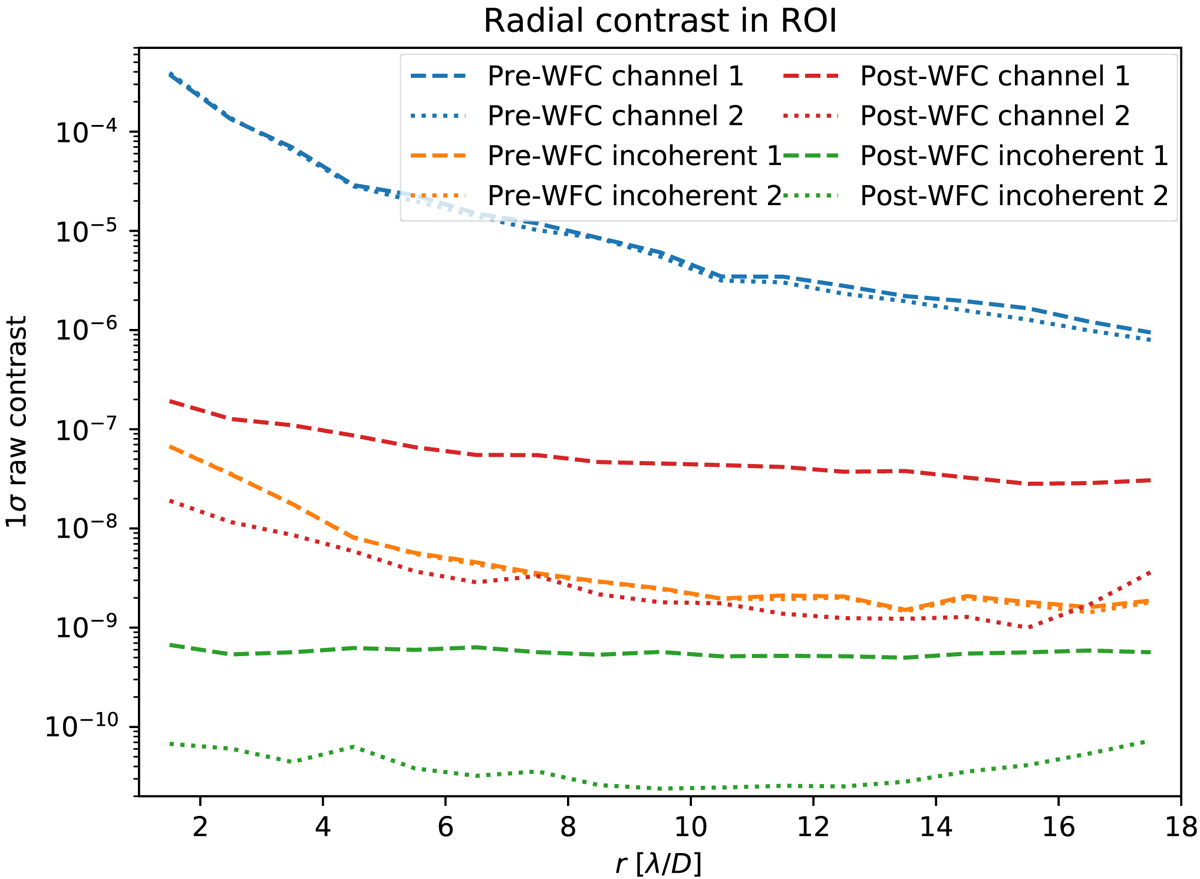
Radial contrast in the ROI for the CDI simulation. Shown are the 1σ raw contrast curves before and after WFC and CDI.
Current usage metrics show cumulative count of Article Views (full-text article views including HTML views, PDF and ePub downloads, according to the available data) and Abstracts Views on Vision4Press platform.
Data correspond to usage on the plateform after 2015. The current usage metrics is available 48-96 hours after online publication and is updated daily on week days.
Initial download of the metrics may take a while.