Fig. 12.
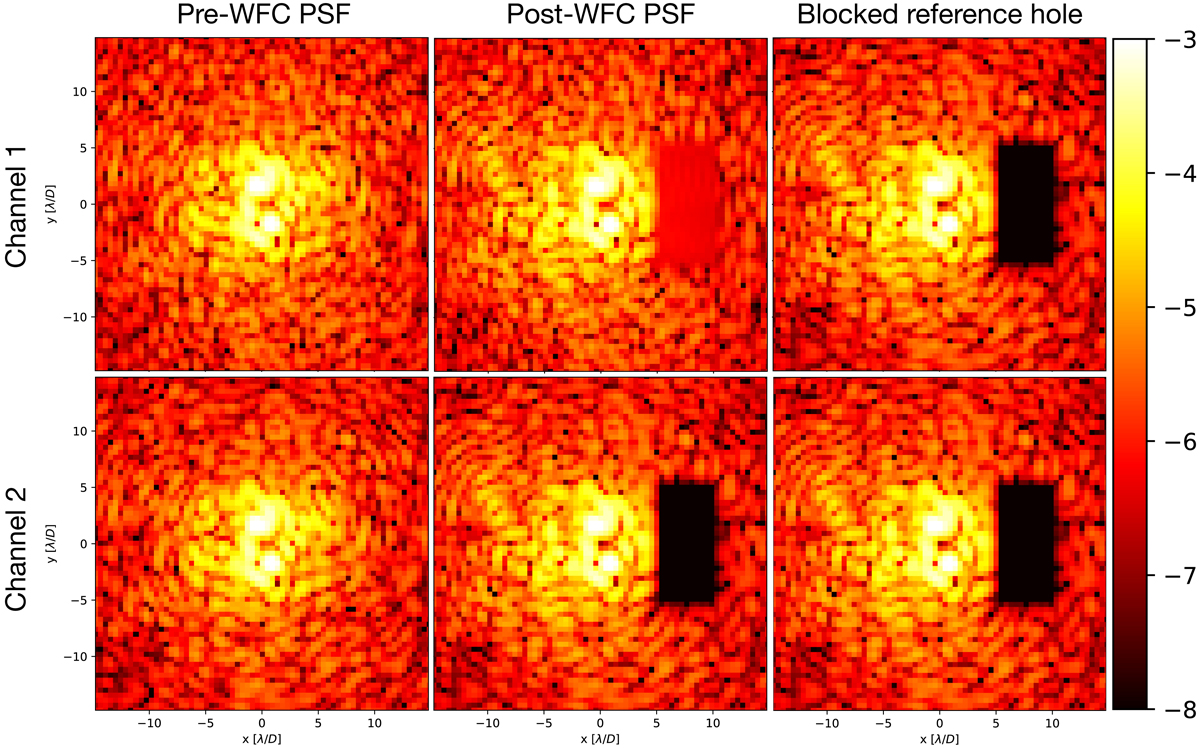
WFC example with the PESCC without noise sources present. The subfigures in the two rows show the PSFs of the two channels. The columns show, respectively, the PSFs before WFC, the PSFs after twenty iterations of the WFC, and the PSFs after the WFC with the RH blocked. The colorbar shows the intensity in logarithmic scale and is equal for all subfigures.
Current usage metrics show cumulative count of Article Views (full-text article views including HTML views, PDF and ePub downloads, according to the available data) and Abstracts Views on Vision4Press platform.
Data correspond to usage on the plateform after 2015. The current usage metrics is available 48-96 hours after online publication and is updated daily on week days.
Initial download of the metrics may take a while.