Fig. 10.
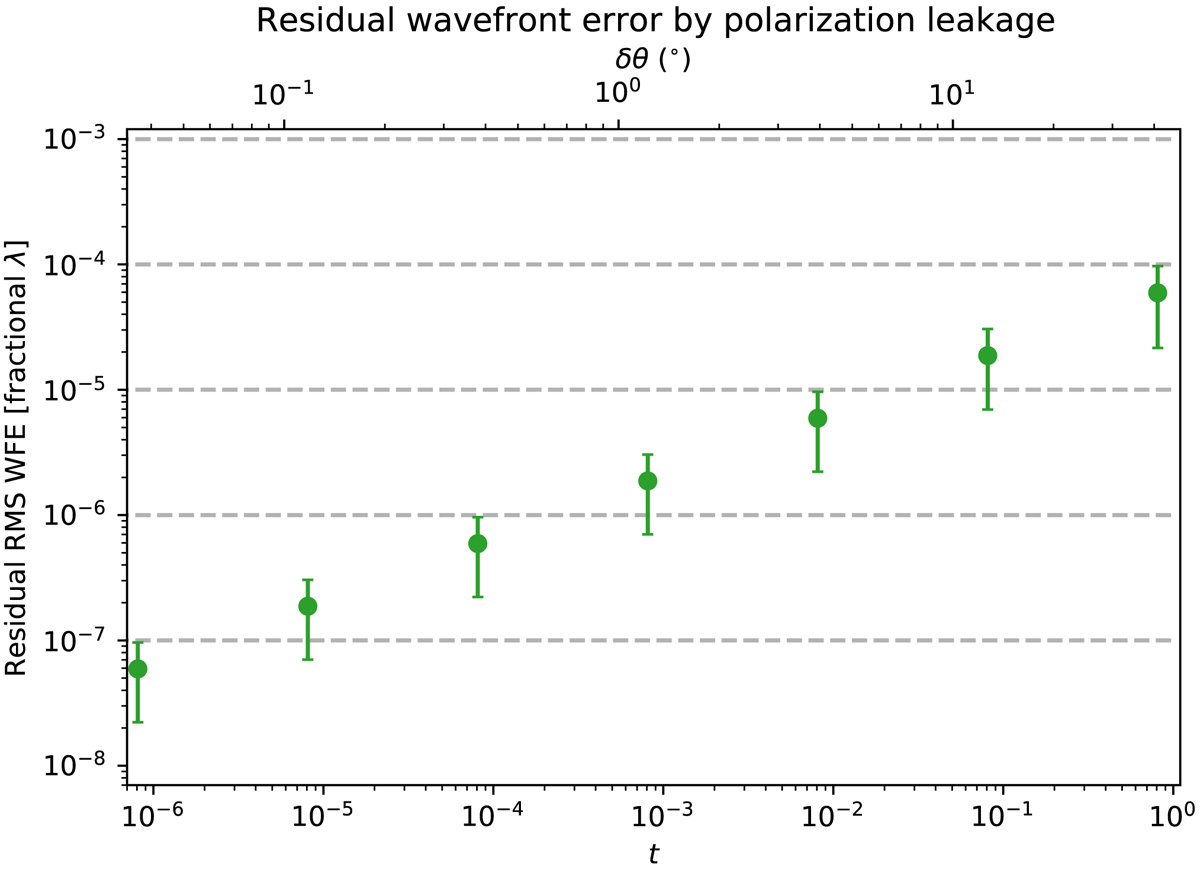
Performance of the wavefront sensing with polarization leakage. The error bars show the 1σ deviation over the 100 random wavefront aberration instances. The bottom x-axis shows polarization leakage (t), and the upper x-axis shows the equivalent rotation offset (δθ) between the RH polarizer and PBS. We note that the right most data point is sampled at t = 0.81.
Current usage metrics show cumulative count of Article Views (full-text article views including HTML views, PDF and ePub downloads, according to the available data) and Abstracts Views on Vision4Press platform.
Data correspond to usage on the plateform after 2015. The current usage metrics is available 48-96 hours after online publication and is updated daily on week days.
Initial download of the metrics may take a while.