Fig. 7.
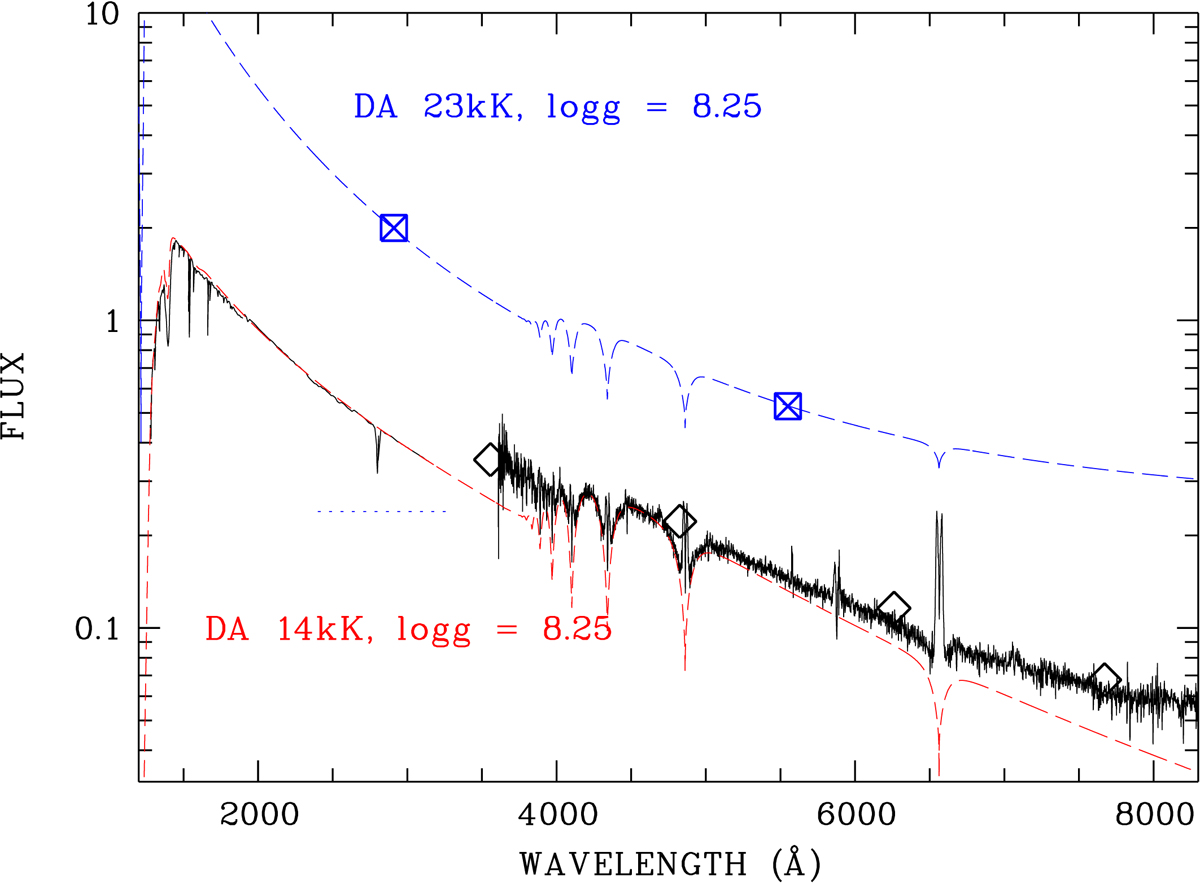
Optical to UV spectral energy distribution of OV Boo. Shown are the pre-outburst spectra from the HST (Uthas et al. 2011) and the SDSS, and pre-outburst SDSS ugri photometric data, together with post-outburst photometric data from the OM and AAVSO (this work). All observed pre-outburst data are shown in black, the two post-outburst data points in blue. White dwarf model spectra for 14 and 23 kK, are shown in red and blue, respectively. Flux units are 10−15 erg cm−2 s−1 Å−1. The 23 kK spectrum was shifted downwards by 0.239 units to account for the non-WD part of the spectrum, whose brightness is indicated by the short blue dashed line at 3000 Å.
Current usage metrics show cumulative count of Article Views (full-text article views including HTML views, PDF and ePub downloads, according to the available data) and Abstracts Views on Vision4Press platform.
Data correspond to usage on the plateform after 2015. The current usage metrics is available 48-96 hours after online publication and is updated daily on week days.
Initial download of the metrics may take a while.