Fig. 6.
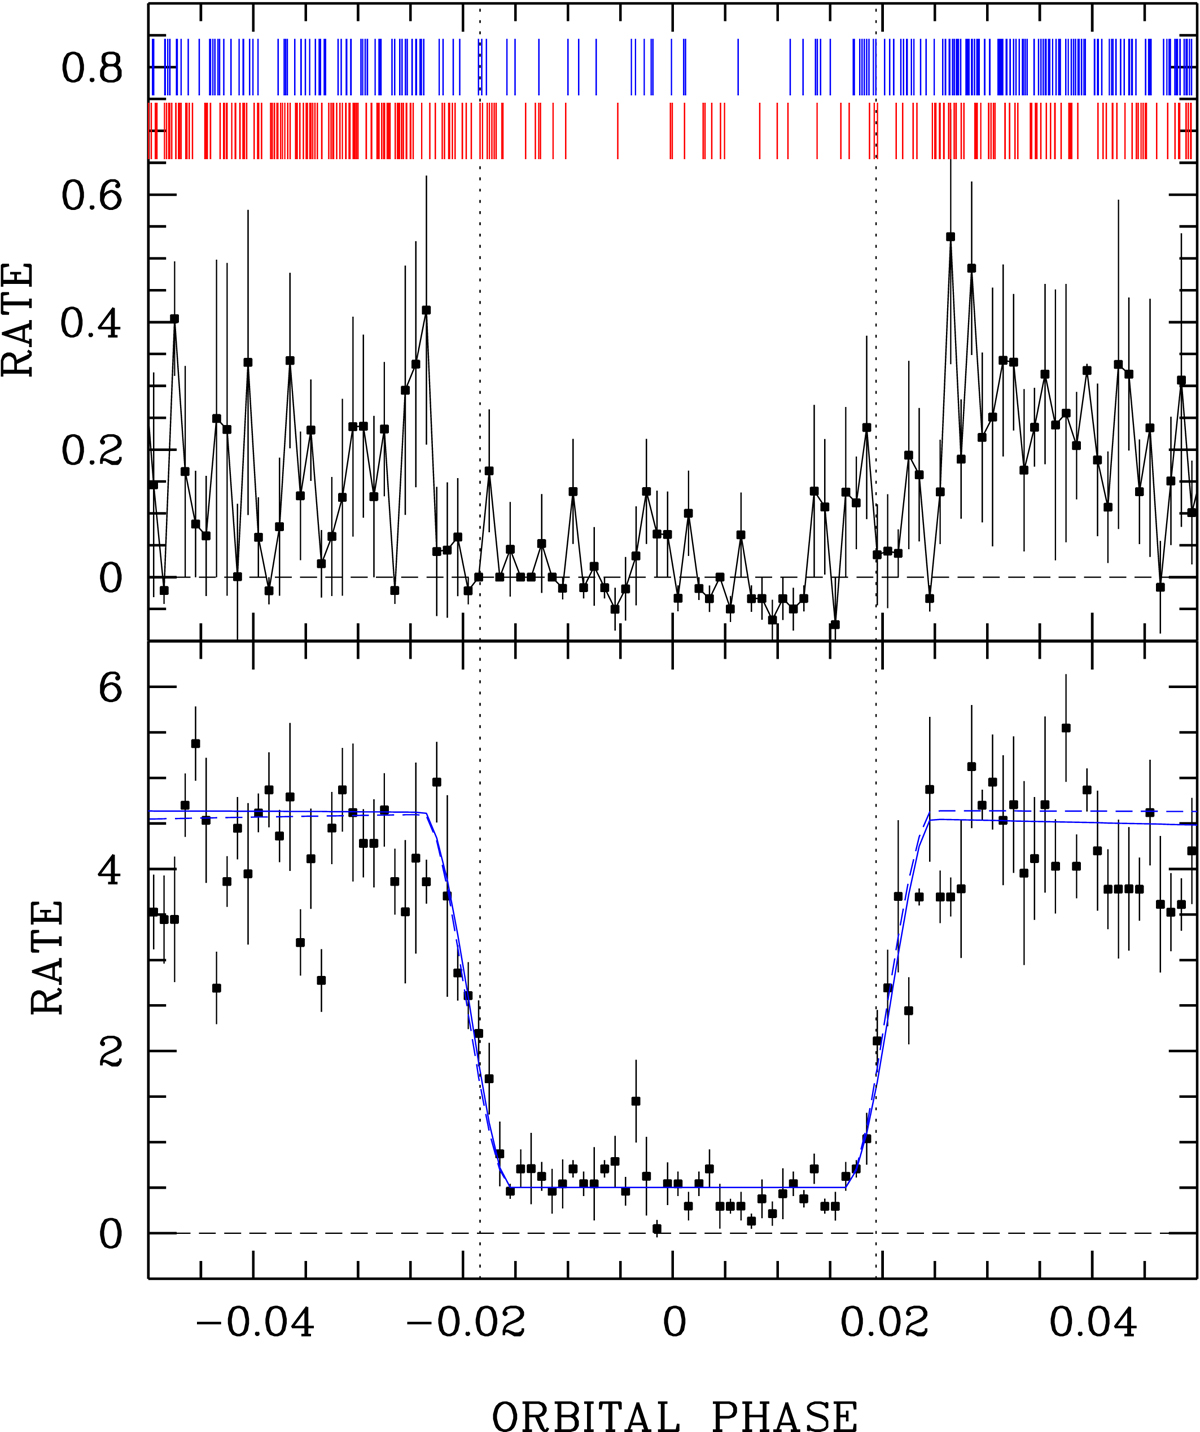
Eclipse profile of OV Boo at X-ray (top) and UV (bottom) energies. The original data from EPIC-pn and the OM were binned with 4 s time resolution and phase-averaged using 1000 phase bins per orbital cycle. The dashed vertical lines indicate the eclipse length of 151 s measured from the OM data shifted by 2 s toward a later phase in agreement with the updated ephemeris (see Fig. 2). The vertical blue ticks in the upper panel indicate arrivals of individual photons (pn, MOS1, and MOS2); the red ticks are the same events reflected about ϕ = 0.0 (corrected for the 2 s offset) to highlight asymmetries in the X-ray eclipse. The curves in the lower panel shown in blue are WD plus spot models whose parameters are explained in the text.
Current usage metrics show cumulative count of Article Views (full-text article views including HTML views, PDF and ePub downloads, according to the available data) and Abstracts Views on Vision4Press platform.
Data correspond to usage on the plateform after 2015. The current usage metrics is available 48-96 hours after online publication and is updated daily on week days.
Initial download of the metrics may take a while.