Fig. 11.
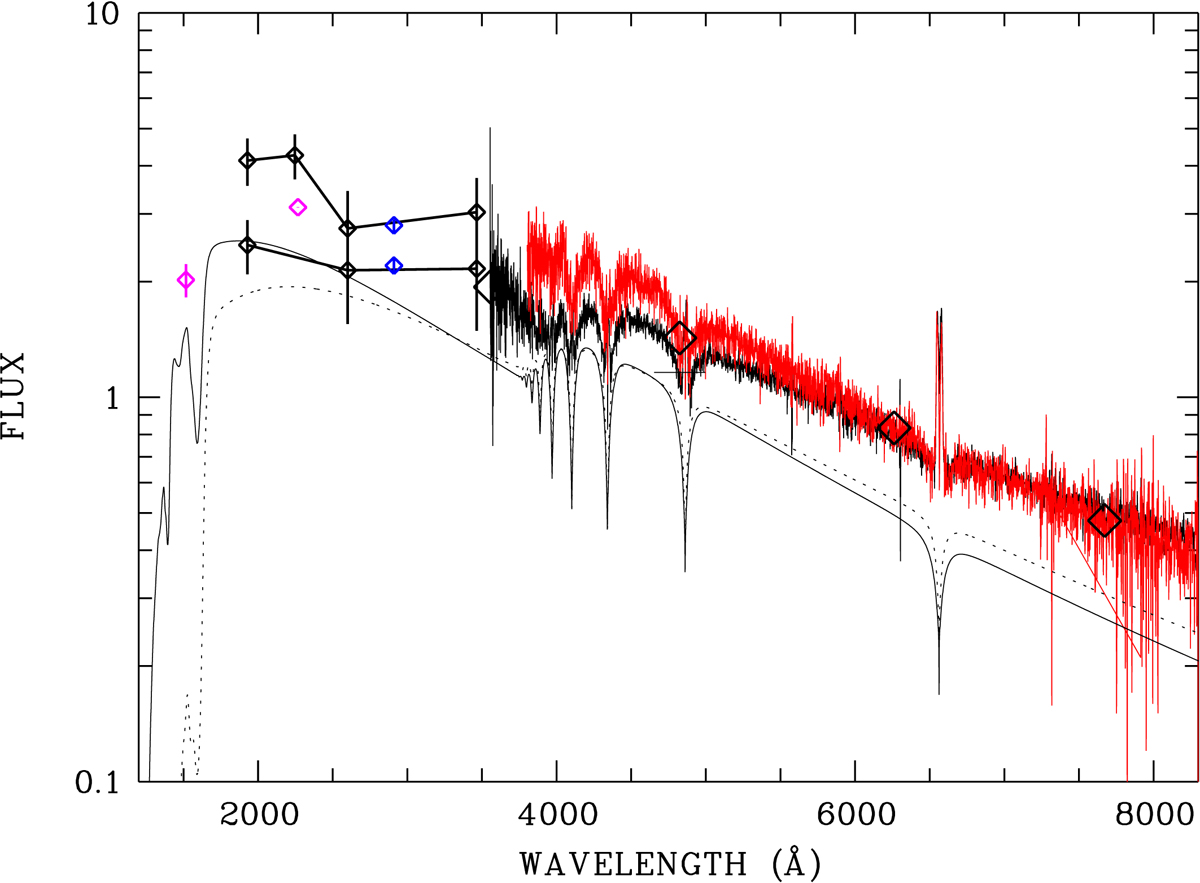
Optical to UV spectral energy distribution of SDSSJ1035. Shown are the two spectra obtained by the SDSS (black and red) plus SDSS photometry (black diamonds), Swift-UVOT photometry (black diamonds), GALEX FUV and NUV data (magenta diamonds), and the XMM-Newton OM observations obtained by us at orbital minimum and maximum (blue diamonds). Swift data obtained at the same epoch are connected with lines. The black solid line is a log g = 8.25, Teff = 11 500 K DA WD model spectrum scaled to a distance of 209 pc. Flux units are 10−16 erg cm−2 s−1 Å−1.
Current usage metrics show cumulative count of Article Views (full-text article views including HTML views, PDF and ePub downloads, according to the available data) and Abstracts Views on Vision4Press platform.
Data correspond to usage on the plateform after 2015. The current usage metrics is available 48-96 hours after online publication and is updated daily on week days.
Initial download of the metrics may take a while.