Fig. 7.
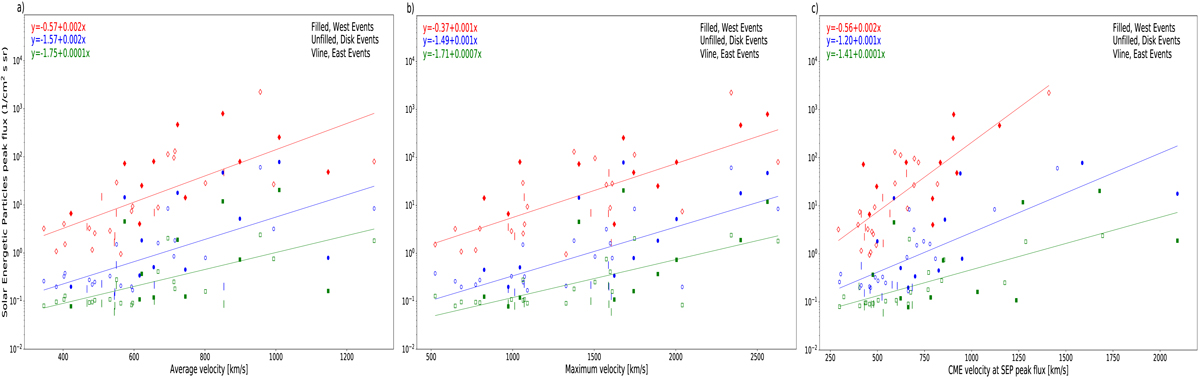
Scatter plots of the average velocity (panel a), maximum velocity (panel b), and the CME velocity at SEP peak flux (panel c) vs SEP peak flux in the > 10 MeV (red), > 50 MeV (blue), and > 100 MeV (green) energy channels. The open symbols represent disk events (longitude −20 < L < 45) and the filled symbols represent west events (longitude > 45) and vertical lines represent east events (longitude < −20).
Current usage metrics show cumulative count of Article Views (full-text article views including HTML views, PDF and ePub downloads, according to the available data) and Abstracts Views on Vision4Press platform.
Data correspond to usage on the plateform after 2015. The current usage metrics is available 48-96 hours after online publication and is updated daily on week days.
Initial download of the metrics may take a while.