Fig. 7.
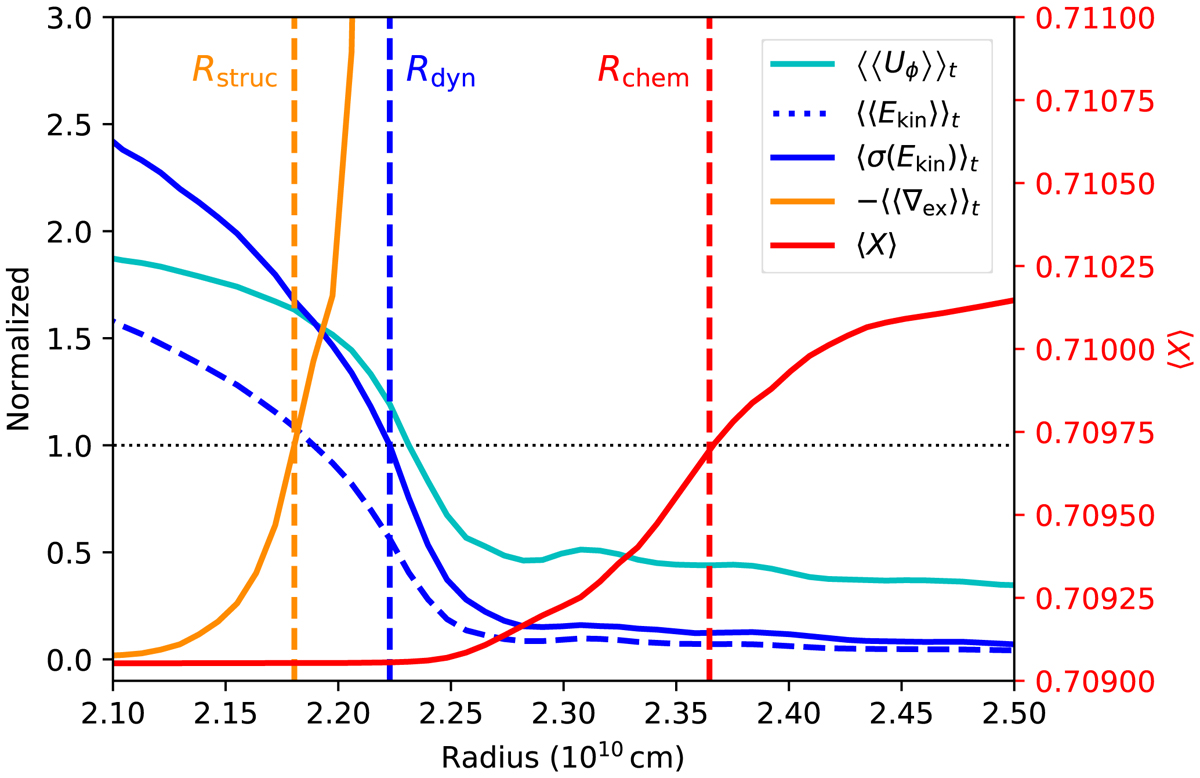
Various radial profiles in the neigbourhood of the convective boundary. ⟨⟨Uϕ⟩⟩t, ⟨⟨Ekin⟩⟩t, and ⟨⟨∇ex⟩⟩t are the combined spatial (indicated by ⟨.⟩) and time (⟨.⟩t) averages of the angular velocity Uϕ, the kinetic energy Ekin, and the superadiabaticity ∇ex = ∇mlt − ∇ad, respectively. The time averages are taken from 1.82 108 s to 2.06 108 s using 100 output files from the H3.5 simulation. ⟨σ(Ekin)⟩t is the time-averaged standard deviation of the kinetic energy (see Eq. (14)). The angularly averaged hydrogen mass fraction profile ⟨X⟩ is taken at 2.06 108 s. The curves of ⟨⟨Uϕ⟩⟩t, ⟨⟨Ekin⟩⟩t, ⟨⟨∇ex⟩⟩t, and ⟨σ(Ekin)⟩t are normalized to the values corresponding to their respective boundary definitions (see text), which means that the black dotted line indicates the boundary values of each line. The dashed vertical lines mark the radial locations of our favoured boundaries.
Current usage metrics show cumulative count of Article Views (full-text article views including HTML views, PDF and ePub downloads, according to the available data) and Abstracts Views on Vision4Press platform.
Data correspond to usage on the plateform after 2015. The current usage metrics is available 48-96 hours after online publication and is updated daily on week days.
Initial download of the metrics may take a while.