Fig. 5.
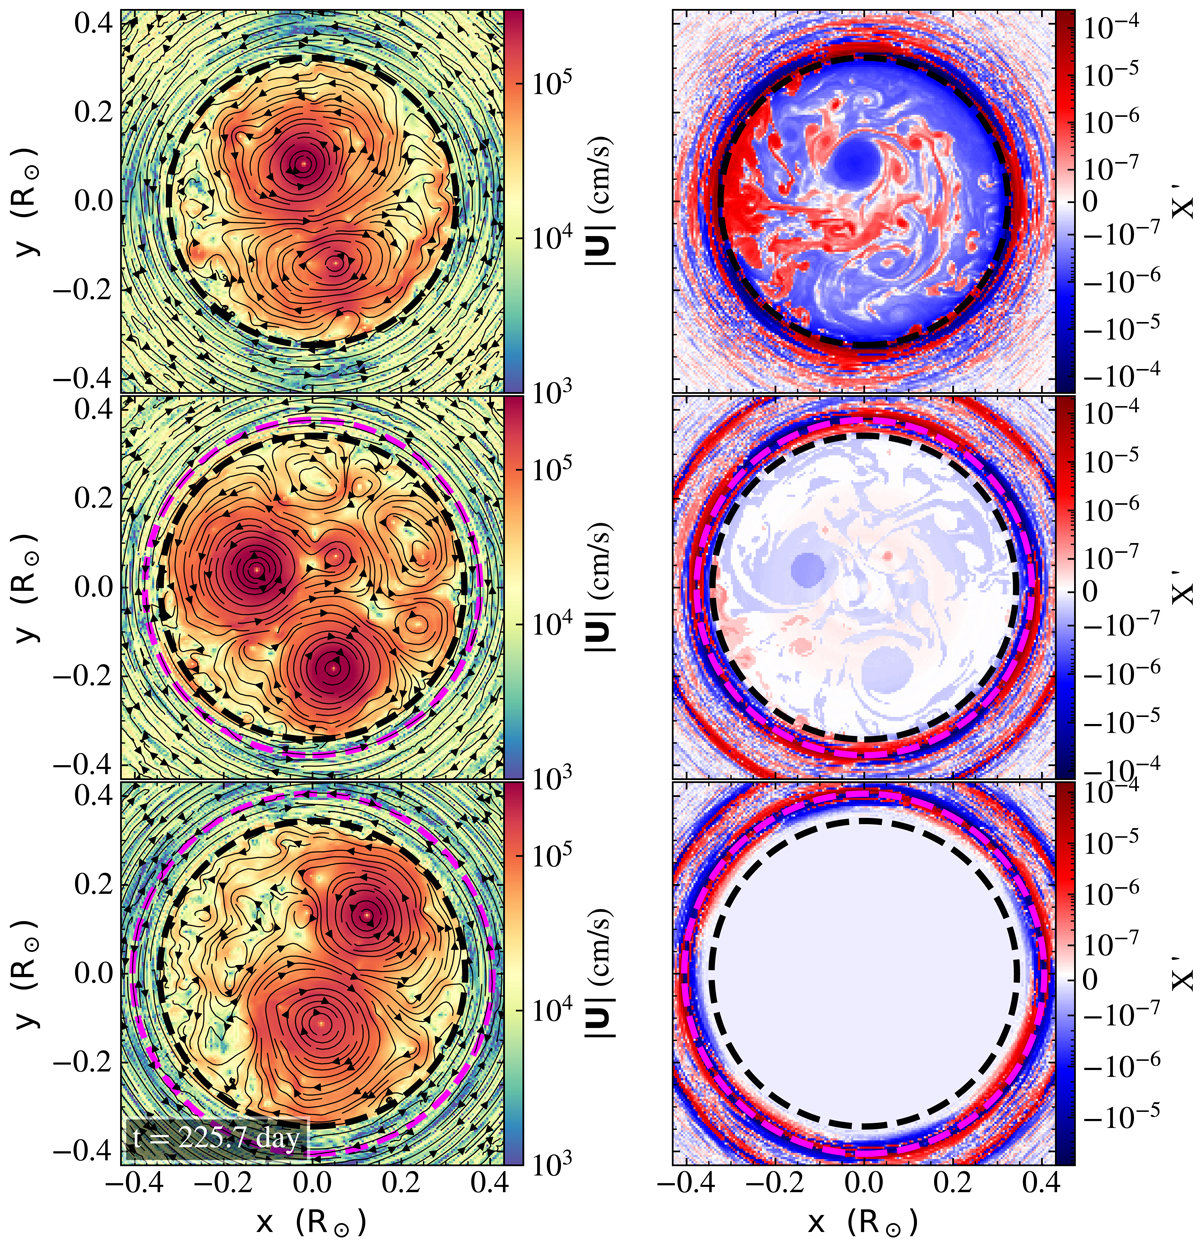
Velocity magnitude (left panels) and deviations of the hydrogen mass fraction from its angulary averaged value X′(x, y) = X(x, y)−⟨X⟩(r) (right panels) of simulation H3.5, H3.5-ov1.7, and H3.5-ov3.0 (from top to bottom) after 2 107 s. The magenta dashed circles mark the initial size of the mixed core, while the black dashed circles show the size of the convective core according to the Schwarzschild criterion. The streamlines in the left panels indicate the flow direction.
Current usage metrics show cumulative count of Article Views (full-text article views including HTML views, PDF and ePub downloads, according to the available data) and Abstracts Views on Vision4Press platform.
Data correspond to usage on the plateform after 2015. The current usage metrics is available 48-96 hours after online publication and is updated daily on week days.
Initial download of the metrics may take a while.