Fig. 3.
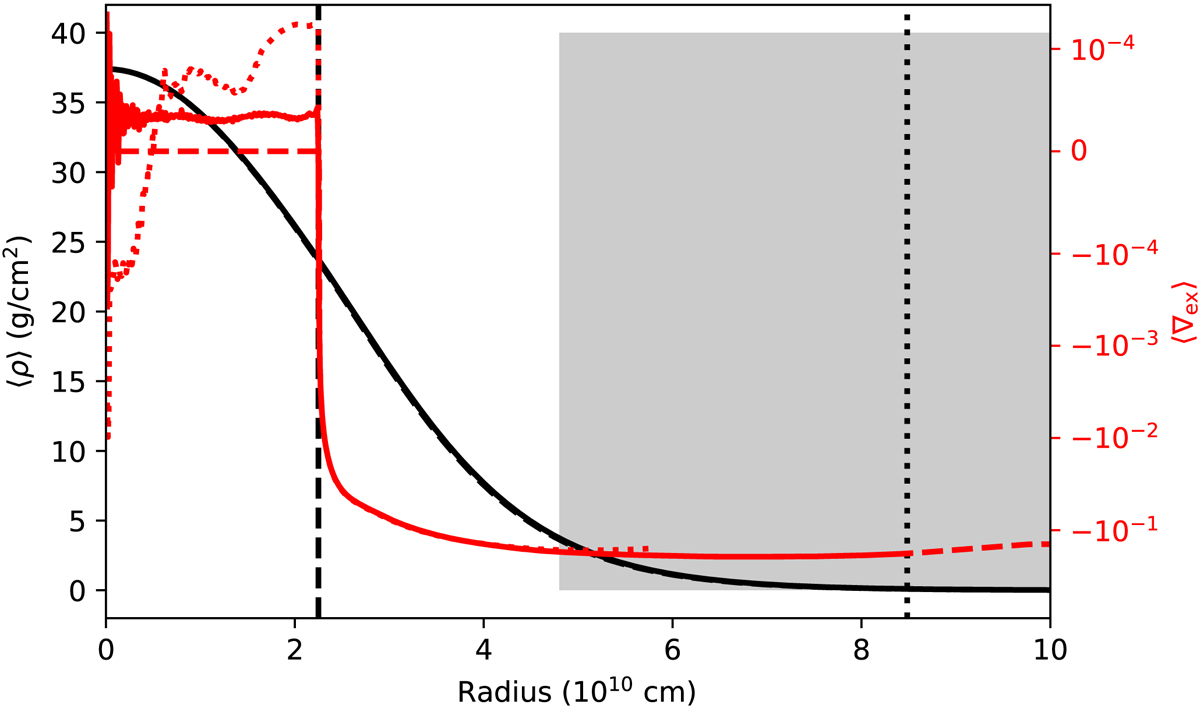
Initial density (black) and superadiabaticity (red) of the model H3.5 (solid; see Table 1) and H3.5-T (dotted), respectively. Dashed lines give the stratification as predicted by Garstec. The vertical dashed and dotted lines indicate the boundary of the convective core and of the computational domain, respectively. In the shaded region we damp the velocities.
Current usage metrics show cumulative count of Article Views (full-text article views including HTML views, PDF and ePub downloads, according to the available data) and Abstracts Views on Vision4Press platform.
Data correspond to usage on the plateform after 2015. The current usage metrics is available 48-96 hours after online publication and is updated daily on week days.
Initial download of the metrics may take a while.