Fig. 23.
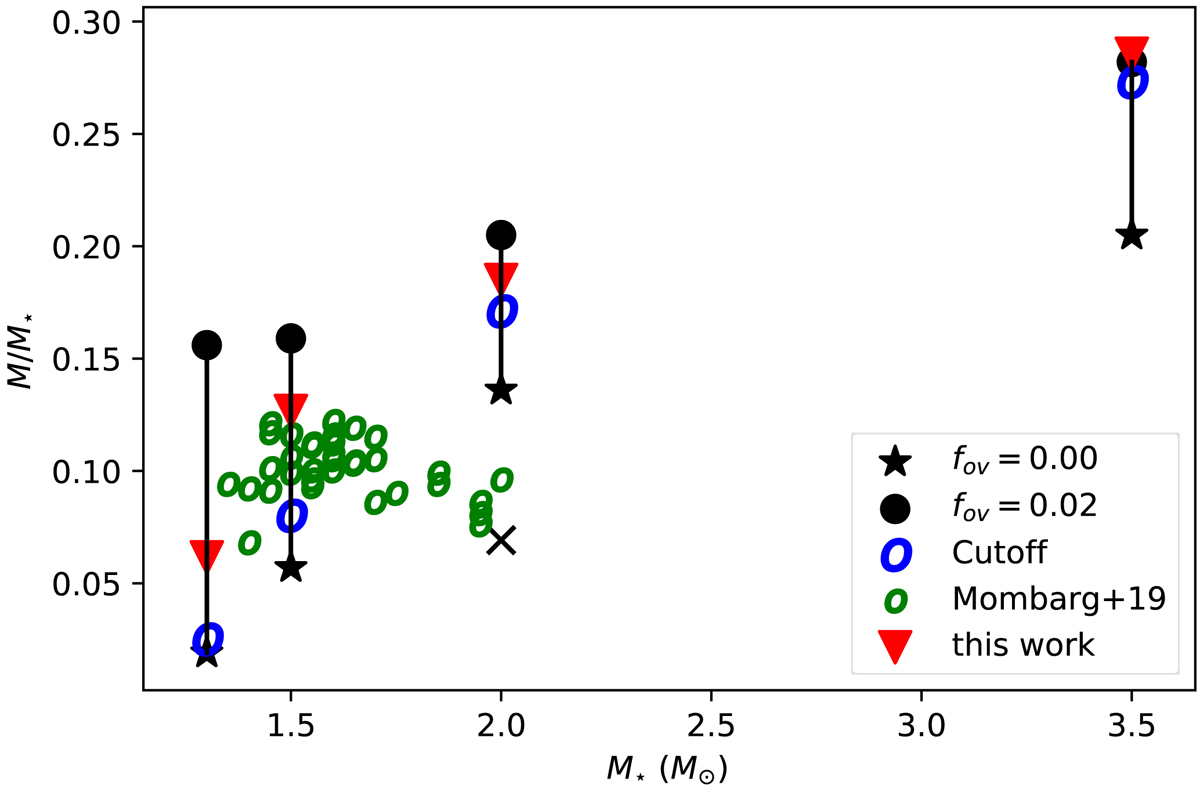
Convectively mixed core mass for models with (black dots) and without overshooting (black stars) on the ZAMS. Blue and green ellipses show the same quantity, but using a geometrical cutoff for the overshooting and observational constraints by Mombarg et al. (2019), respectively. The red triangles denote the derived upper limits from our simulations. The black cross indicates the size of the mixed core of a 2.0 M⊙ star close to the end of its main-sequence evolution when the model is computed without overshooting.
Current usage metrics show cumulative count of Article Views (full-text article views including HTML views, PDF and ePub downloads, according to the available data) and Abstracts Views on Vision4Press platform.
Data correspond to usage on the plateform after 2015. The current usage metrics is available 48-96 hours after online publication and is updated daily on week days.
Initial download of the metrics may take a while.