Fig. 16.
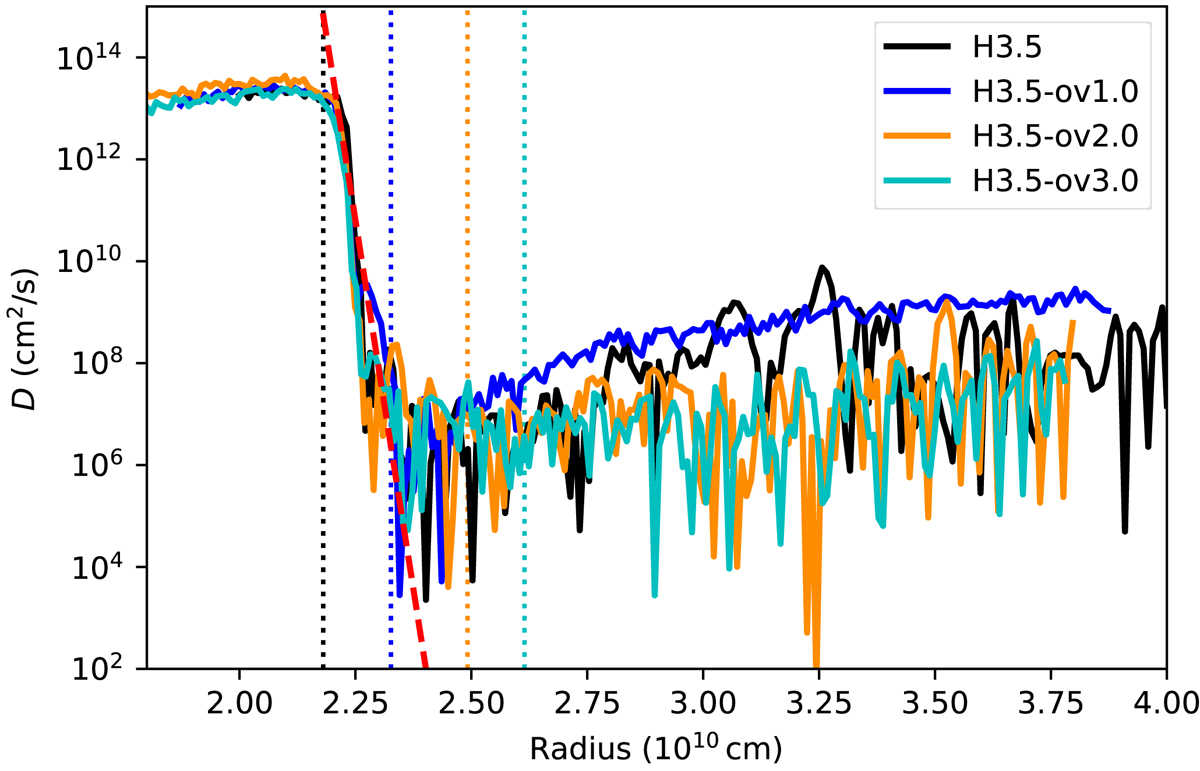
Radial diffusion coefficients estimated from 40 000 tracer particles over 2.5 106 s for the models with different initial values of fov. The lines have been shifted such that the radial position of the structural boundary matches for all the simulations. The dotted vertical lines indicate the position of Rchem in each run. The red dashed line shows D according to Eq. (11) with fov = 0.01
Current usage metrics show cumulative count of Article Views (full-text article views including HTML views, PDF and ePub downloads, according to the available data) and Abstracts Views on Vision4Press platform.
Data correspond to usage on the plateform after 2015. The current usage metrics is available 48-96 hours after online publication and is updated daily on week days.
Initial download of the metrics may take a while.