Fig. 11.
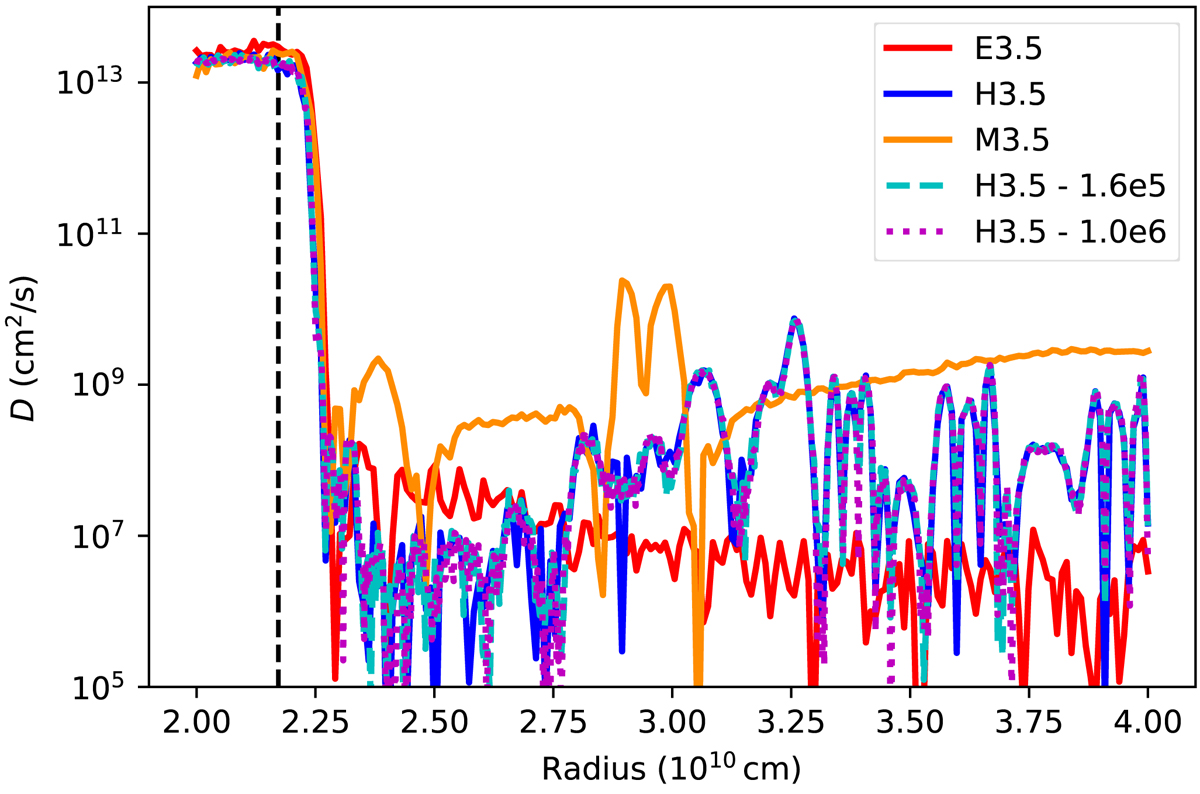
Radial diffusion coefficients estimated from the advection of 40 000 tracer particles followed for 1.5 106 s for models of different grid size. The dashed and dotted lines labelled ‘H3.5 – 1.6e5’ and ‘H3.5 – 1.0e6’ represent the same quantity but evaluated with 160 000 and 106 tracer particles in model H3.5, respectively. The dashed vertical line indicates Rdyn of model H3.5.
Current usage metrics show cumulative count of Article Views (full-text article views including HTML views, PDF and ePub downloads, according to the available data) and Abstracts Views on Vision4Press platform.
Data correspond to usage on the plateform after 2015. The current usage metrics is available 48-96 hours after online publication and is updated daily on week days.
Initial download of the metrics may take a while.