Open Access
Fig. 10.
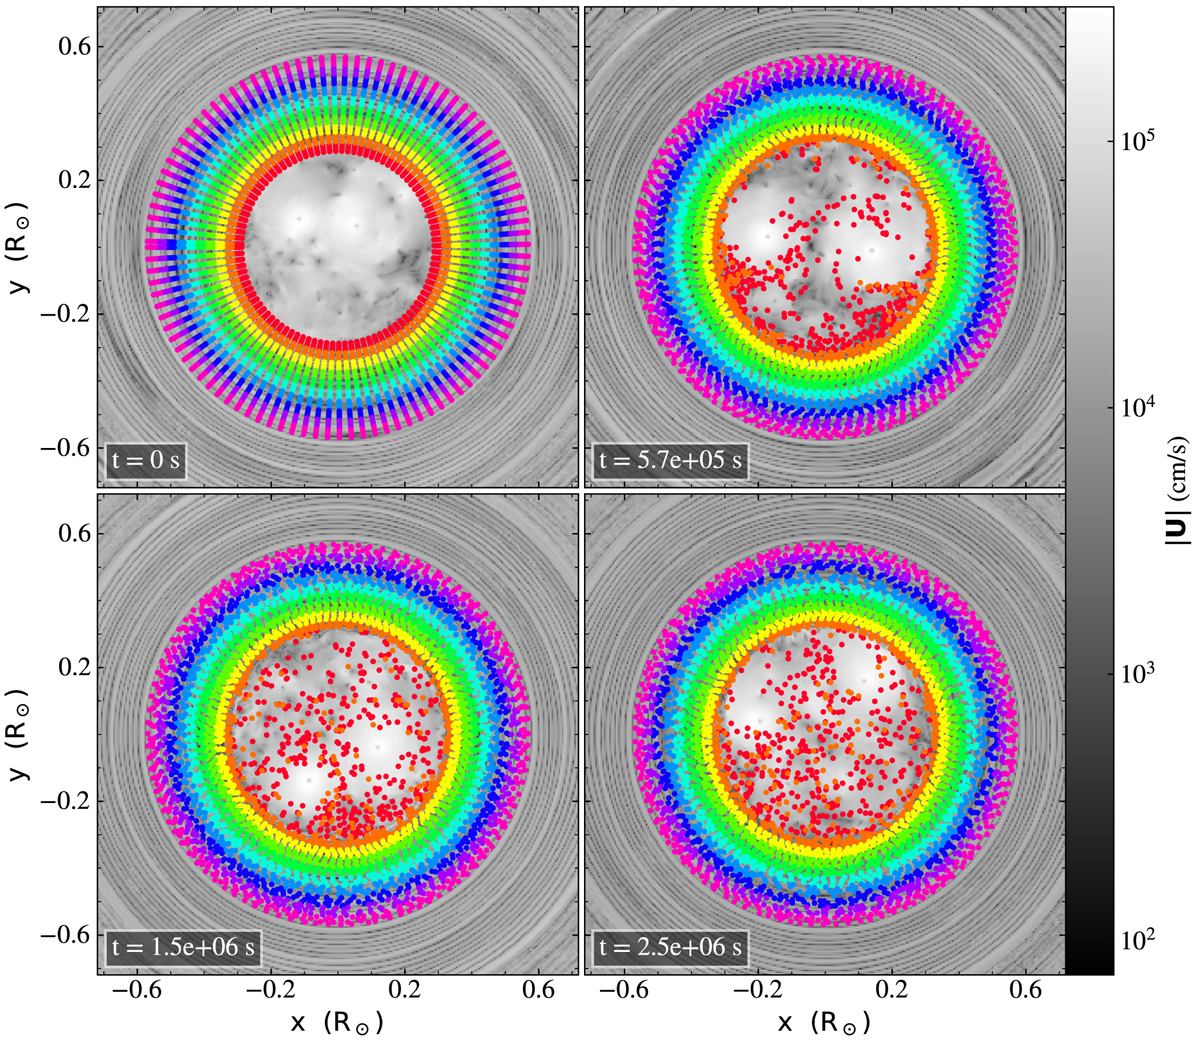
Distribution of tracer particles for model H3.5 at several epochs. We show only 4000 of the 40 000 tracer particles used in the simulation, which are coloured according to their initial radial location given in the upper left panel.
Current usage metrics show cumulative count of Article Views (full-text article views including HTML views, PDF and ePub downloads, according to the available data) and Abstracts Views on Vision4Press platform.
Data correspond to usage on the plateform after 2015. The current usage metrics is available 48-96 hours after online publication and is updated daily on week days.
Initial download of the metrics may take a while.