Fig. B.1.
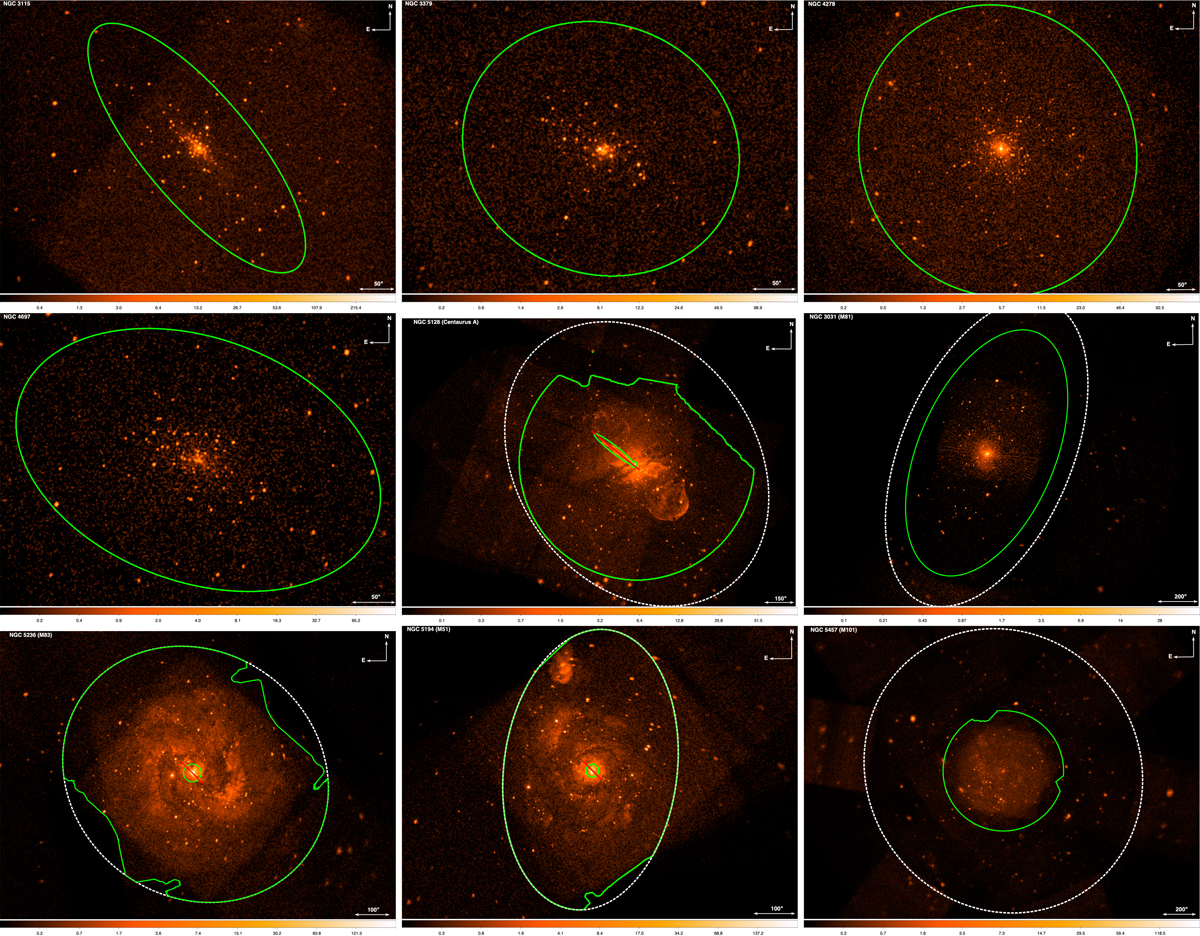
0.3−2 keV band false-color images (smoothed) of galaxies in our sample. Dashed white regions correspond to D25. Green lines show regions used for source detection having exposure map values greater than 20% of maximal value (for more detail see Sect. 3.1). Stellar masses listed in Table 2 are computed for these regions. The inside areas of small green regions near the center of Centaurus A, M 83 and M 51 were excluded from analysis.
Current usage metrics show cumulative count of Article Views (full-text article views including HTML views, PDF and ePub downloads, according to the available data) and Abstracts Views on Vision4Press platform.
Data correspond to usage on the plateform after 2015. The current usage metrics is available 48-96 hours after online publication and is updated daily on week days.
Initial download of the metrics may take a while.