Fig. 5.
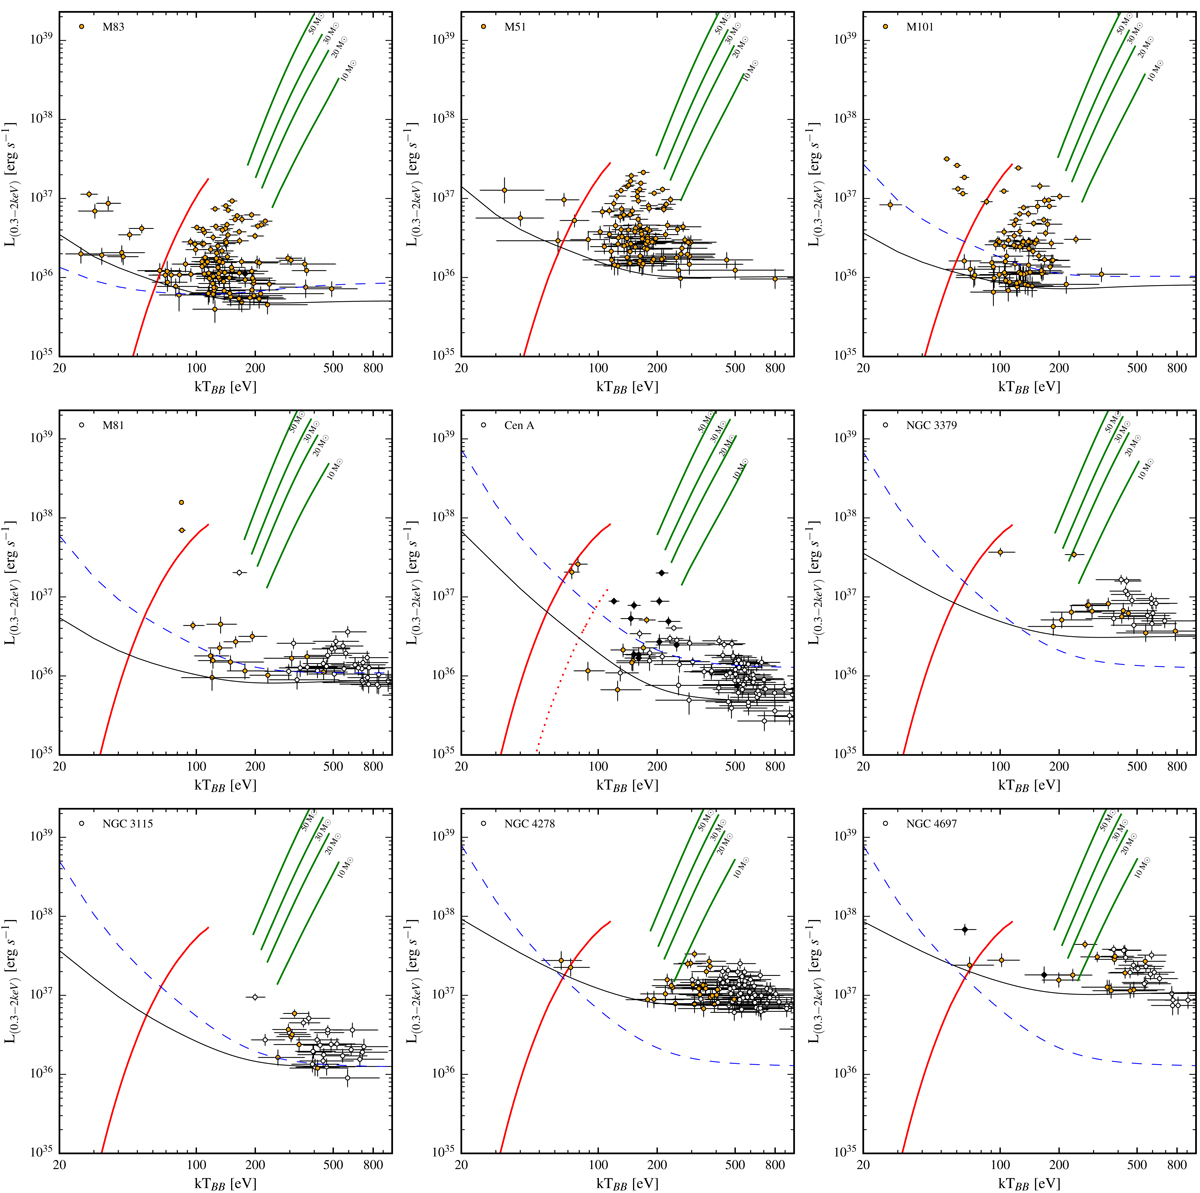
kTbb − LX diagram for soft X-ray sources in the galaxies of our sample. A cut of 20 net counts was applied. The luminosities are in the 0.3−2.0 keV band and are not corrected for absorption. All plotted sources have no statistically significant flux above 2 keV (open circles). Sources with median energy Ẽ ≤ 1.2 keV are shown with solid orange circles. Sources with Gaia matches of measured parallax or proper motion are marked by black diamonds. Solid red curves show kTbb − LX relations at the lower boundary of stable nuclear burning. Along these curves, the WD mass increases from 0.51 M⊙ at the lower left end to 1.34 M⊙ at the upper right end. The dotted red line for Centaurus A shows the location of this boundary in the dust lanes of this galaxy. Green lines correspond to the emission spectrum of the general relativistic accretion disk model around a Schwarzschild BH (Ebisawa et al. 1991) for BH masses of 10, 20, 30, and 50 M⊙. The accretion rate changes along the curves from 0.02 ṀEdd to 1 ṀEdd. Horizontally oriented solid black curves show the luminosity corresponding to 20 net counts. The dashed blue line on each plot shows the 20 counts luminosity limit for M 51 corrected for the difference in absorption column density between M 51 and the galaxy under consideration. All model curves show absorbed luminosities. Errors are at 1σ confidence. See Sect. 5.2 for details of calculations.
Current usage metrics show cumulative count of Article Views (full-text article views including HTML views, PDF and ePub downloads, according to the available data) and Abstracts Views on Vision4Press platform.
Data correspond to usage on the plateform after 2015. The current usage metrics is available 48-96 hours after online publication and is updated daily on week days.
Initial download of the metrics may take a while.