Fig. 2.
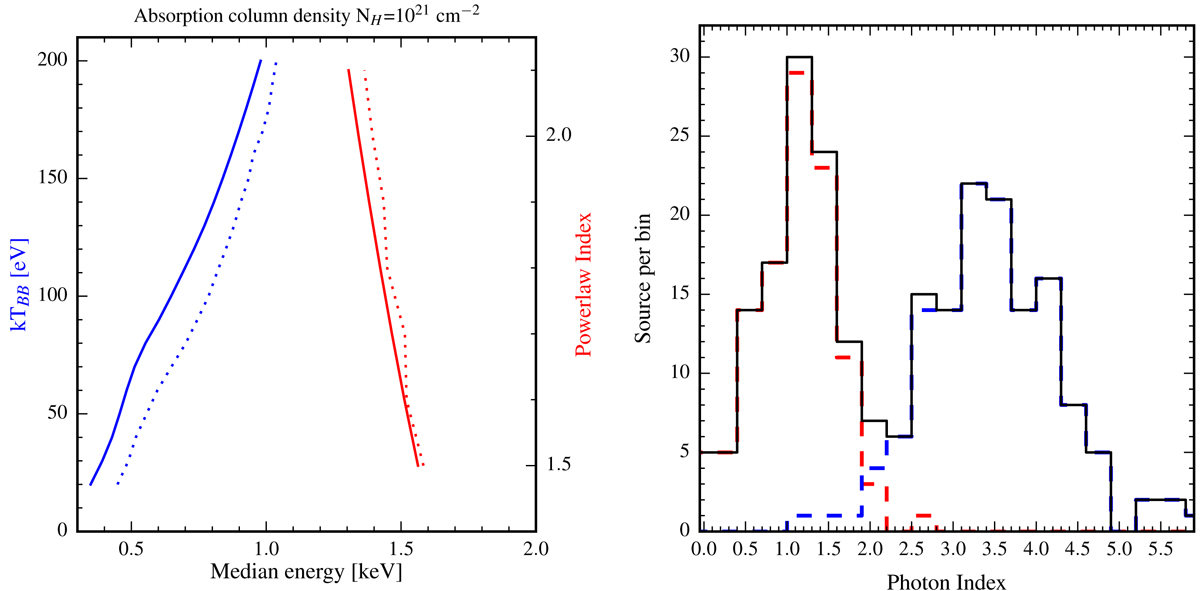
Left: relation of the median energy to the temperature of a black-body model (left-hand curves and y-axis, blue in the color version of this plot) and to the photon index of a power-law model (right curves and y-axis, red). Simulations for the Chandra ACIS-S detector with Cycle 13 (2012) response. An absorption column density of 1021 cm−2 was assumed. Solid lines show models without background, dotted lines show models with 50% contribution of background counts. Parameter ranges are relevant to super-soft sources and X-ray binaries, and the two types of spectra are clearly separated at about Ẽ ≈ 1.0−1.3 keV. Right: verification of the source classification procedure in M 51. Distribution of sources with median energy Ẽ ≤ 2 keV over the photon index of the power-law model. The blue and red dashed histograms show the distributions of sources classified as soft and hard, respectively, and the black solid line indicates the total distribution.
Current usage metrics show cumulative count of Article Views (full-text article views including HTML views, PDF and ePub downloads, according to the available data) and Abstracts Views on Vision4Press platform.
Data correspond to usage on the plateform after 2015. The current usage metrics is available 48-96 hours after online publication and is updated daily on week days.
Initial download of the metrics may take a while.