Fig. 9
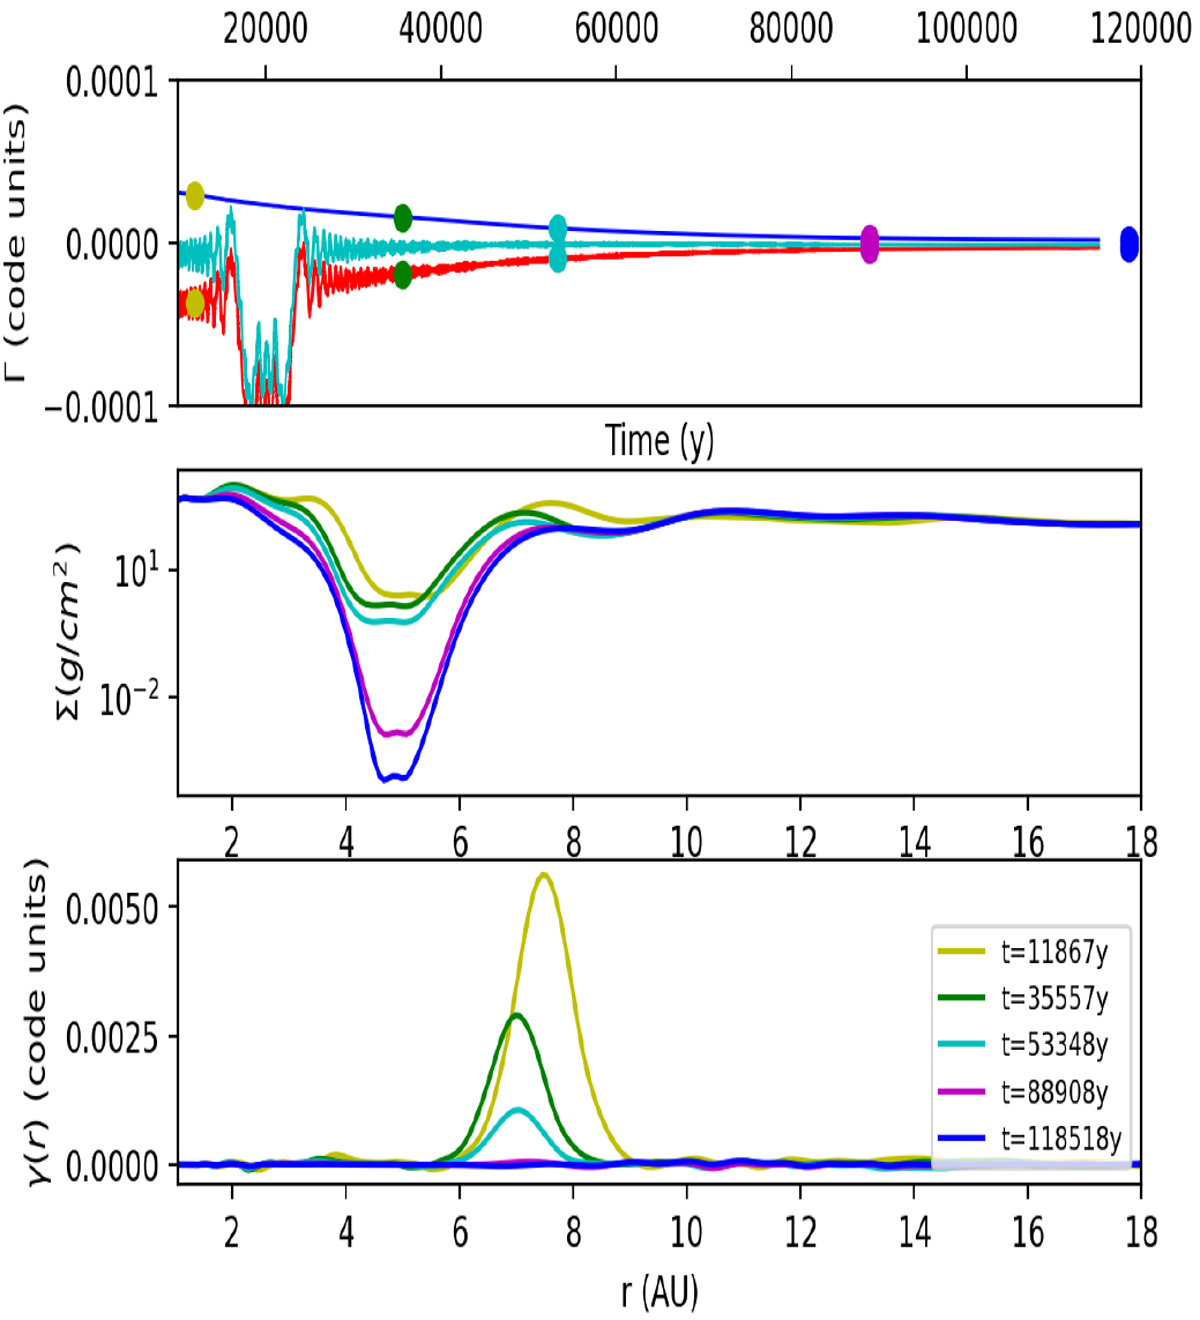
Top panel: evolution of specific torques from the inner (blue curve) and outer disc (red curve) and of the total specific torque (cyan) in simulation M3D. A runningaverage has been applied over 500 orbits to smooth out the oscillations of the torque exerted by the outer disc. Such oscillations are due the synodic period of the vortex with respect to the planet. At times corresponding to the dots in the top panel (the same times selected in Figs. 7 and 8) we plot: (middle panel) surface density profiles; (bottom panel) specific radial torque density γ(r) (see Eq. (2) in the text).
Current usage metrics show cumulative count of Article Views (full-text article views including HTML views, PDF and ePub downloads, according to the available data) and Abstracts Views on Vision4Press platform.
Data correspond to usage on the plateform after 2015. The current usage metrics is available 48-96 hours after online publication and is updated daily on week days.
Initial download of the metrics may take a while.