Open Access
Fig. 7
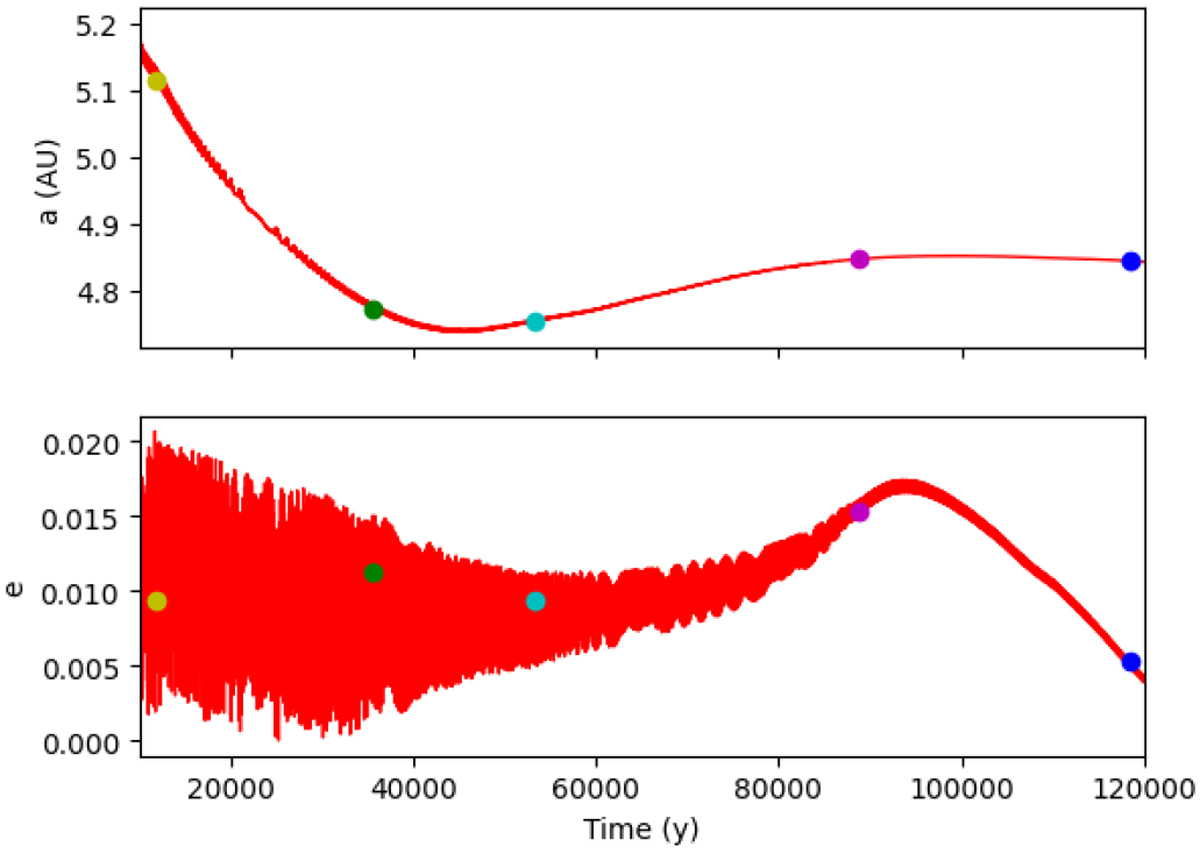
Evolution of semi-major axis and eccentricity for a migrating planet in simulation M3D. Notice the outward migration after 45 000 yr. The colored dots give the values of (a, e) at times corresponding to the panels of Fig. 8.
Current usage metrics show cumulative count of Article Views (full-text article views including HTML views, PDF and ePub downloads, according to the available data) and Abstracts Views on Vision4Press platform.
Data correspond to usage on the plateform after 2015. The current usage metrics is available 48-96 hours after online publication and is updated daily on week days.
Initial download of the metrics may take a while.