Fig. 4
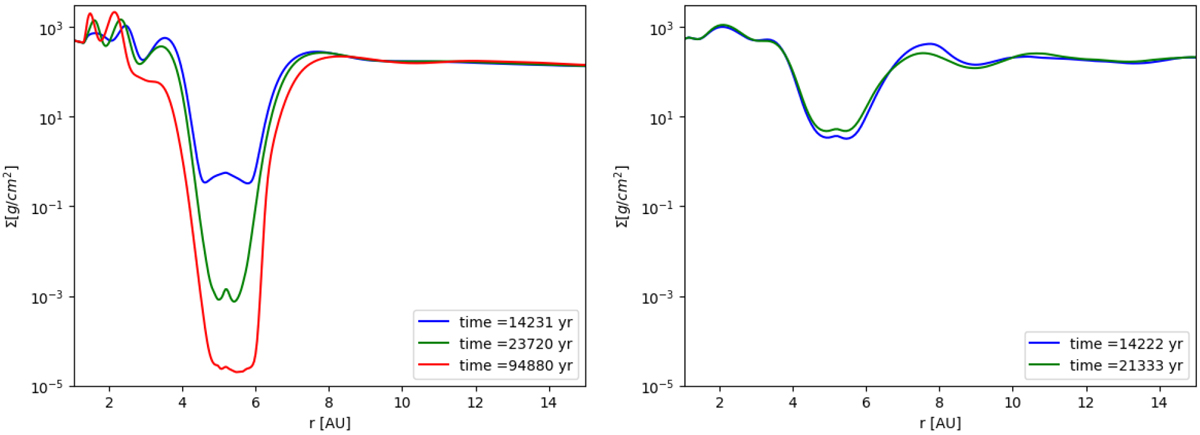
Azimuthally-averaged radial surface density profiles at different times for nominal disc mass (M) simulations with a Jupiter-mass planet at 5.2 au. Left panel: same as the left panel of Fig. 3 for simulation M2D, except that the scale on the y-axis is logarithmic, to appreciate the gap’s depth and its evolution with time. Right panel: same for the M3D simulation. The gaps in 2D and 3D inviscid discs (with adiabatic EoS and a cooling timescale equal to one planet’s orbital period) appear very different; see text for discussion.
Current usage metrics show cumulative count of Article Views (full-text article views including HTML views, PDF and ePub downloads, according to the available data) and Abstracts Views on Vision4Press platform.
Data correspond to usage on the plateform after 2015. The current usage metrics is available 48-96 hours after online publication and is updated daily on week days.
Initial download of the metrics may take a while.