Fig. 8.
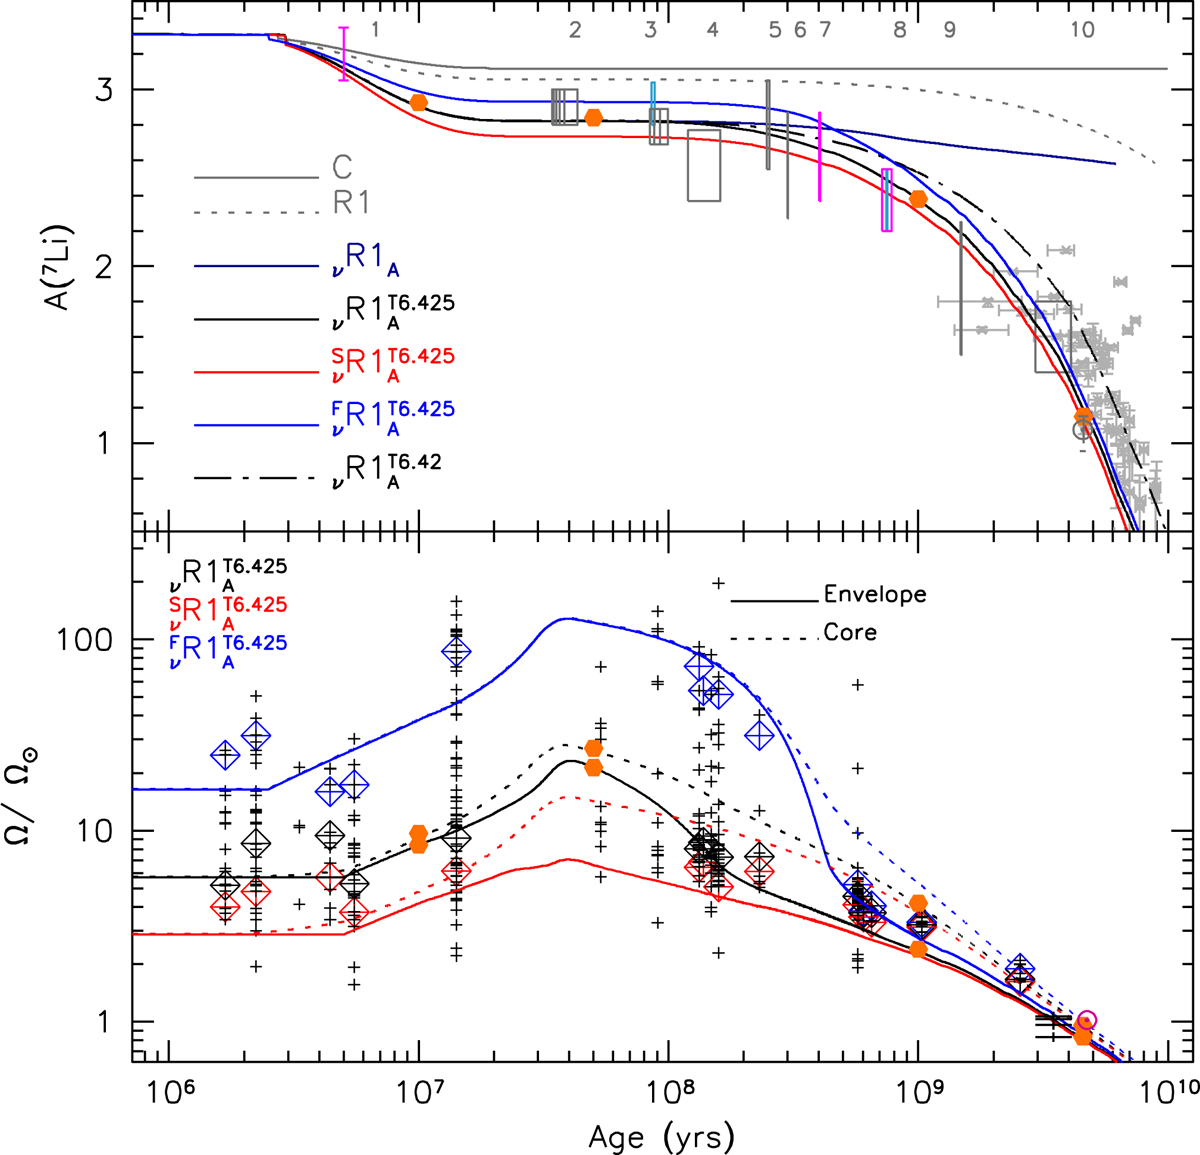
Same as Fig. 1, but for the different R1 models, the selected ![]() model with different initial rotation velocities, and the classical model (C). The orange dots refer to the ages at which the diffusion coefficient profiles are shown in Fig. 7. The red, black, and blue open squares show the 25th, 50th and 90th percentiles of the observed rotational distributions in each cluster.
model with different initial rotation velocities, and the classical model (C). The orange dots refer to the ages at which the diffusion coefficient profiles are shown in Fig. 7. The red, black, and blue open squares show the 25th, 50th and 90th percentiles of the observed rotational distributions in each cluster.
Current usage metrics show cumulative count of Article Views (full-text article views including HTML views, PDF and ePub downloads, according to the available data) and Abstracts Views on Vision4Press platform.
Data correspond to usage on the plateform after 2015. The current usage metrics is available 48-96 hours after online publication and is updated daily on week days.
Initial download of the metrics may take a while.